

Time Domain Representation of Continuous and Discrete Signals
93
1.5 Application Problems
P.1.1 Sketch by hand, over the range −3 ≤ t ≤ 6, the following analog functions:
a. ƒ 1 (t) = 5u(t − 2)
b. ƒ 2 (t) = 3u(t − 1) − 3u(t − 3)
c. ƒ 3 (t) = t[u(t − 1) − u(t − 2)]
d. ƒ 4 (t) = δ(t + 1) + 2δ(t − 1) + u(t − 2)
e. ƒ 5 (t) = t[u(−t) * u(t + 3)]
f. ƒ 6 (t) = u(t + 1) − u(t) + 3δ(t − 3)
P.1.2 Sketch by hand, over the range −3 ≤ n ≤ 6, the following discrete sequences:
a. ƒ 1 (n) = 3(n − 2)u(n)
b. ƒ 2 (n) = n u(n)
c. ƒ 3 (n) = (−n)2 u(n)
d. ƒ 4 (n) = −3δ(n + 2) + 2δ(n) + u(n) + u(n − 1) + 2u(n − 1)
e. ƒ 5 (n) = 2η[u(n) − u(n − 2)]
f. ƒ 6 (n) = n[u(n + 2) . u(−n)]
1
0.5
−0.5
−1
−10
−5
0
0
5
1 0
1
0.5
−0.5
−1
−10
−5
0
1
0.5
−0.5
−1
0
0
5
1 0
−10
−5
0
5
1 0
1
0.5
−0.5
−1
−10
−5
0
0
5
1 0
[f(t)*Kaiser window] versus t
[f(t)*Boxcar window] versus t
[f(t)*Triang. window] versus t
[f(t)*Barlett. window] versus t
t
t
t
t
Amplitude
Amplitude
Amplitude
Amplitude
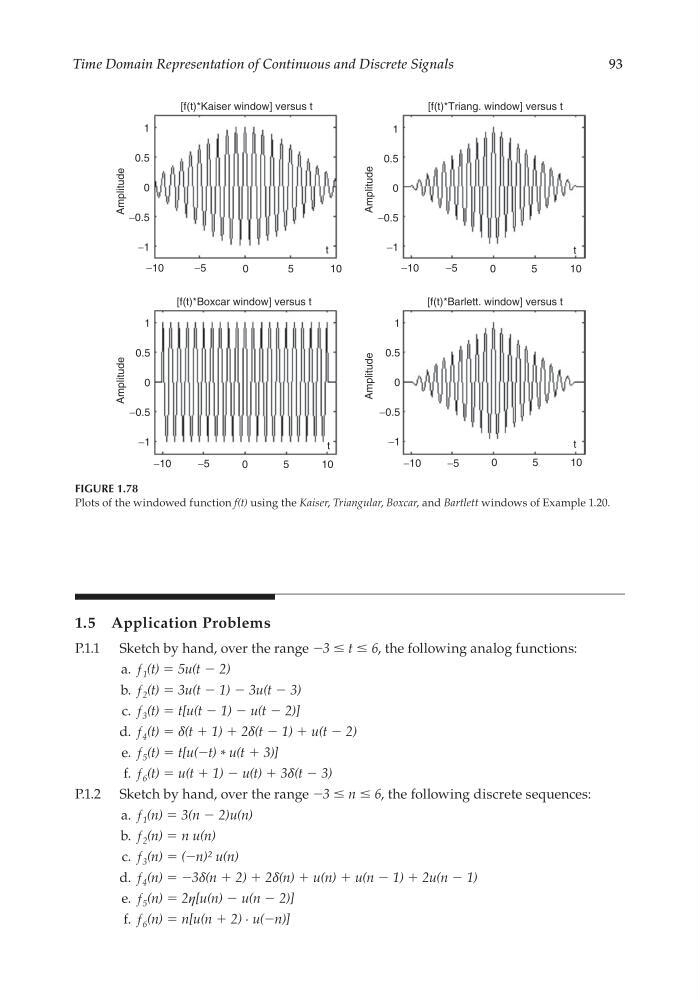
FIGURE 1.78
Plots of the windowed function f(t) using the Kaiser, Triangular, Boxcar, and Bartlett windows of Example 1.20.
CRC_47760_CH001.indd 93
CRC_47760_CH001.indd 93
7/25/2008 4:16:30 PM
7/25/2008 4:16:30 PM
93
1.5 Application Problems
P.1.1 Sketch by hand, over the range −3 ≤ t ≤ 6, the following analog functions:
a. ƒ 1 (t) = 5u(t − 2)
b. ƒ 2 (t) = 3u(t − 1) − 3u(t − 3)
c. ƒ 3 (t) = t[u(t − 1) − u(t − 2)]
d. ƒ 4 (t) = δ(t + 1) + 2δ(t − 1) + u(t − 2)
e. ƒ 5 (t) = t[u(−t) * u(t + 3)]
f. ƒ 6 (t) = u(t + 1) − u(t) + 3δ(t − 3)
P.1.2 Sketch by hand, over the range −3 ≤ n ≤ 6, the following discrete sequences:
a. ƒ 1 (n) = 3(n − 2)u(n)
b. ƒ 2 (n) = n u(n)
c. ƒ 3 (n) = (−n)2 u(n)
d. ƒ 4 (n) = −3δ(n + 2) + 2δ(n) + u(n) + u(n − 1) + 2u(n − 1)
e. ƒ 5 (n) = 2η[u(n) − u(n − 2)]
f. ƒ 6 (n) = n[u(n + 2) . u(−n)]
1
0.5
−0.5
−1
−10
−5
0
0
5
1 0
1
0.5
−0.5
−1
−10
−5
0
1
0.5
−0.5
−1
0
0
5
1 0
−10
−5
0
5
1 0
1
0.5
−0.5
−1
−10
−5
0
0
5
1 0
[f(t)*Kaiser window] versus t
[f(t)*Boxcar window] versus t
[f(t)*Triang. window] versus t
[f(t)*Barlett. window] versus t
t
t
t
t
Amplitude
Amplitude
Amplitude
Amplitude
FIGURE 1.78
Plots of the windowed function f(t) using the Kaiser, Triangular, Boxcar, and Bartlett windows of Example 1.20.
CRC_47760_CH001.indd 93
CRC_47760_CH001.indd 93
7/25/2008 4:16:30 PM
7/25/2008 4:16:30 PM