

3.1 Physical/Mechanical Pretreatments
(a) Milling
It is a physical/mechanical pretreatment technology where
the structural configurations are disrupted thereby reducing
cellulose crystallinity of lignocellulosic materials (Vidal and
Molinier 1988). The most commonly used technology in this
group is the ball milling method, here the balls present
within the cycle on interaction with the biomass reduce its
particle size (Sarkar et al. 2012). The biggest profit of this
method is zero usage of chemical supplements which in turn
do not lead to the production of inhibitors; hence it is
environment friendly (Sarkar et al. 2012). However, high
energy requirements and high energy costs are some of its
limitations. For instance, several cycles and passes of longer
duration are required for sugarcane bagasse pretreatment
(Koo et al. 2011).
(b) Microwave
Microwave pretreatment has emerged as a substitute to
heating pretreatment process. In these processes, electromagnetic waves directly interact with the object, which is
efficient and easy to operate unlike conventional heating
where superficial heat transfer occurs (Binod et al. 2012).
Short reaction time and homogenous heating are some of the
advantages of this process (Segneanu et al. 2011). Biomass
Table 2 Properties of mixed food waste used in biogas production investigation
Parameters
References
pH
*MC %
*TS %
*VS %
C
H
N
S
C/N
*TC
–
–
30.9
26.35
46.78
–
3.16
2.51
14.8
–
Zhang et al. (2007)
4.60
–
16.8
16.1
–
–
4.0
–
–
99.0
Kim and Shin (2008)
5.51
83.8
16.2
86.1
–
–
2.3
–
21.0
–
Jayalakshmi et al. (2009)
6.3
85.6
14.4
89.5
45.9
5.8
2.21
0.10
23.2
NR
Ramzan et al. (2010)
6.5
–
18.1
17.1
46.67
–
3.54
0.33
13.2
61.9
Zhang et al. (2011)
4.2
–
23.1
21.0
56.3
–
2.3
–
24.5
–
Zhang et al. (2013)
5.17
–
8.8
8.26
–
–
1.25
–
–
–
Cárdenas-Cleves et al. (2018)
4.74
–
–
–
51.0
–
–
–
12.4
50.6
Ho and Chu (2019)
4.86
–
–
–
48.3
–
–
–
12.6
52.2
5.53
–
–
–
52.5
–
–
–
17.4
65.0
4.2
–
23.8
22.9
52.4
7.4
3.3
1.52
9.39
–
Hegde and Trabold (2019)
–
–
–
–
74.51
19.91
5.58
0.00
13.36
137.01
Hamzah et al. (2019)
5.3
78.10
21.90
96.76
53.76
–
2.92
5.33
18.31
–
Jansson et al. (2019)
*MC = Moisture Content, TS = Total Solid, VS = Volatile Solids, TC = Total Carbohydrates
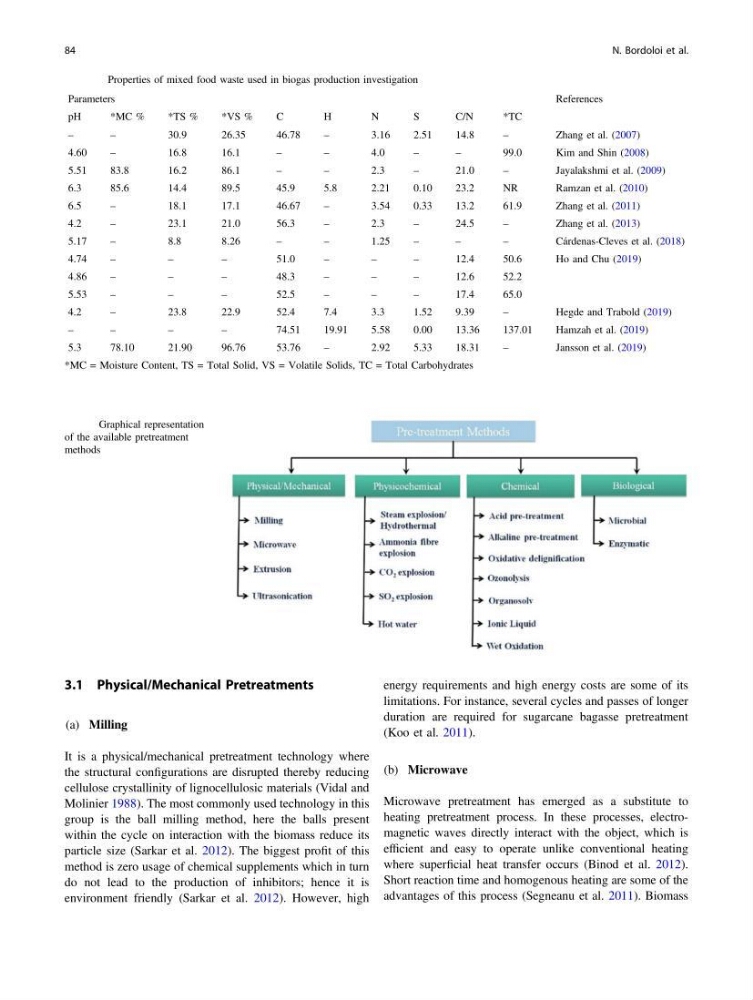
Fig. 3 Graphical representation
of the available pretreatment
methods
84
N. Bordoloi et al.
(a) Milling
It is a physical/mechanical pretreatment technology where
the structural configurations are disrupted thereby reducing
cellulose crystallinity of lignocellulosic materials (Vidal and
Molinier 1988). The most commonly used technology in this
group is the ball milling method, here the balls present
within the cycle on interaction with the biomass reduce its
particle size (Sarkar et al. 2012). The biggest profit of this
method is zero usage of chemical supplements which in turn
do not lead to the production of inhibitors; hence it is
environment friendly (Sarkar et al. 2012). However, high
energy requirements and high energy costs are some of its
limitations. For instance, several cycles and passes of longer
duration are required for sugarcane bagasse pretreatment
(Koo et al. 2011).
(b) Microwave
Microwave pretreatment has emerged as a substitute to
heating pretreatment process. In these processes, electromagnetic waves directly interact with the object, which is
efficient and easy to operate unlike conventional heating
where superficial heat transfer occurs (Binod et al. 2012).
Short reaction time and homogenous heating are some of the
advantages of this process (Segneanu et al. 2011). Biomass
Table 2 Properties of mixed food waste used in biogas production investigation
Parameters
References
pH
*MC %
*TS %
*VS %
C
H
N
S
C/N
*TC
–
–
30.9
26.35
46.78
–
3.16
2.51
14.8
–
Zhang et al. (2007)
4.60
–
16.8
16.1
–
–
4.0
–
–
99.0
Kim and Shin (2008)
5.51
83.8
16.2
86.1
–
–
2.3
–
21.0
–
Jayalakshmi et al. (2009)
6.3
85.6
14.4
89.5
45.9
5.8
2.21
0.10
23.2
NR
Ramzan et al. (2010)
6.5
–
18.1
17.1
46.67
–
3.54
0.33
13.2
61.9
Zhang et al. (2011)
4.2
–
23.1
21.0
56.3
–
2.3
–
24.5
–
Zhang et al. (2013)
5.17
–
8.8
8.26
–
–
1.25
–
–
–
Cárdenas-Cleves et al. (2018)
4.74
–
–
–
51.0
–
–
–
12.4
50.6
Ho and Chu (2019)
4.86
–
–
–
48.3
–
–
–
12.6
52.2
5.53
–
–
–
52.5
–
–
–
17.4
65.0
4.2
–
23.8
22.9
52.4
7.4
3.3
1.52
9.39
–
Hegde and Trabold (2019)
–
–
–
–
74.51
19.91
5.58
0.00
13.36
137.01
Hamzah et al. (2019)
5.3
78.10
21.90
96.76
53.76
–
2.92
5.33
18.31
–
Jansson et al. (2019)
*MC = Moisture Content, TS = Total Solid, VS = Volatile Solids, TC = Total Carbohydrates
Fig. 3 Graphical representation
of the available pretreatment
methods
84
N. Bordoloi et al.