

2.6 Thermodynamic Parameters of Adsorption
39
process is endothermic in nature. Also, the positive value of (S°) indicates increased
degree of randomness at solid–solution interface during the adsorption process of
heavy metal ions onto the adsorbent. This result therefore demonstrates that the
adsorption of metal ions onto the adsorbent increases with increase in temperature
(Table 2.3).
2.7 Adsorption Kinetics
To comprehend the kinetic behaviour of the binding process of metal ions onto
the modified G/CR-CS, linear forms of pseudo-first-order and pseudo-second-order
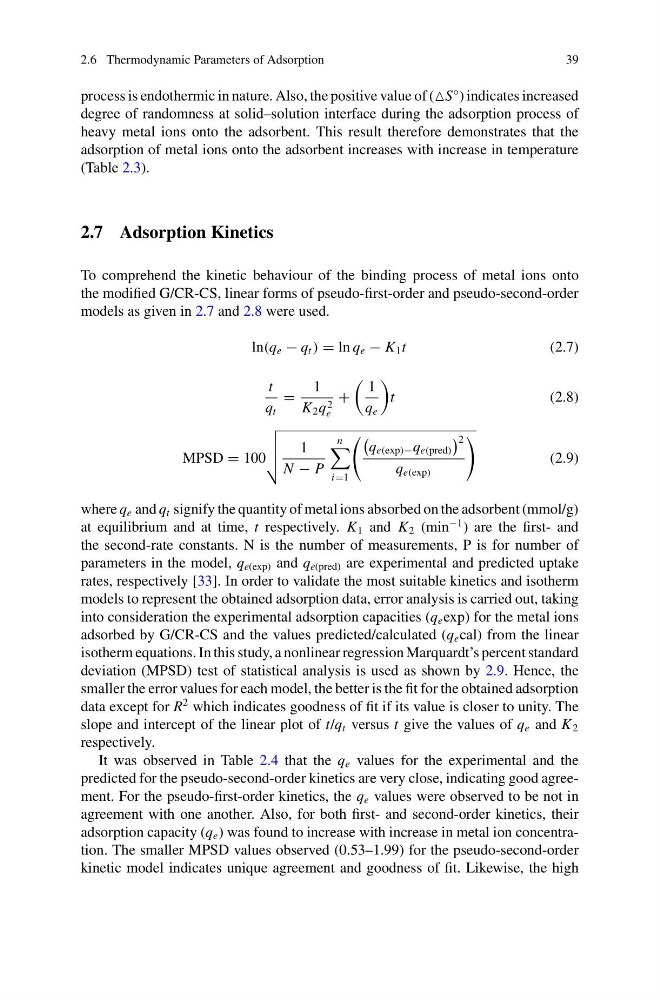
models as given in 2.7 and 2.8 were used.
ln(q e − q t ) = ln q e − K 1 t
(2.7)
t
q t
=
1
K 2 q 2
e
+
1
q e
t
(2.8)
MPSD = 100
1
N − P
n
i=1
q e(exp)− q e(pred)
2
q e(exp)
(2.9)
where q e and q t signify the quantity of metal ions absorbed on the adsorbent (mmol/g)
at equilibrium and at time, t respectively. K 1 and K 2 (min
−1 ) are the first- and
the second-rate constants. N is the number of measurements, P is for number of
parameters in the model, q e(exp) and q e(pred) are experimental and predicted uptake
rates, respectively [33]. In order to validate the most suitable kinetics and isotherm
models to represent the obtained adsorption data, error analysis is carried out, taking
into consideration the experimental adsorption capacities (q e exp) for the metal ions
adsorbed by G/CR-CS and the values predicted/calculated (q e cal) from the linear
isotherm equations. In this study, a nonlinear regression Marquardt’s percent standard
deviation (MPSD) test of statistical analysis is used as shown by 2.9. Hence, the
smaller the error values for each model, the better is the fit for the obtained adsorption
data except for R
2 which indicates goodness of fit if its value is closer to unity. The
slope and intercept of the linear plot of t/q t versus t give the values of q e and K 2
respectively.
It was observed in Table 2.4 that the q e values for the experimental and the
predicted for the pseudo-second-order kinetics are very close, indicating good agreement. For the pseudo-first-order kinetics, the q e values were observed to be not in
agreement with one another. Also, for both first- and second-order kinetics, their
adsorption capacity (q e ) was found to increase with increase in metal ion concentration. The smaller MPSD values observed (0.53–1.99) for the pseudo-second-order
kinetic model indicates unique agreement and goodness of fit. Likewise, the high
39
process is endothermic in nature. Also, the positive value of (S°) indicates increased
degree of randomness at solid–solution interface during the adsorption process of
heavy metal ions onto the adsorbent. This result therefore demonstrates that the
adsorption of metal ions onto the adsorbent increases with increase in temperature
(Table 2.3).
2.7 Adsorption Kinetics
To comprehend the kinetic behaviour of the binding process of metal ions onto
the modified G/CR-CS, linear forms of pseudo-first-order and pseudo-second-order
models as given in 2.7 and 2.8 were used.
ln(q e − q t ) = ln q e − K 1 t
(2.7)
t
q t
=
1
K 2 q 2
e
+
1
q e
t
(2.8)
MPSD = 100
1
N − P
n
i=1
q e(exp)− q e(pred)
2
q e(exp)
(2.9)
where q e and q t signify the quantity of metal ions absorbed on the adsorbent (mmol/g)
at equilibrium and at time, t respectively. K 1 and K 2 (min
−1 ) are the first- and
the second-rate constants. N is the number of measurements, P is for number of
parameters in the model, q e(exp) and q e(pred) are experimental and predicted uptake
rates, respectively [33]. In order to validate the most suitable kinetics and isotherm
models to represent the obtained adsorption data, error analysis is carried out, taking
into consideration the experimental adsorption capacities (q e exp) for the metal ions
adsorbed by G/CR-CS and the values predicted/calculated (q e cal) from the linear
isotherm equations. In this study, a nonlinear regression Marquardt’s percent standard
deviation (MPSD) test of statistical analysis is used as shown by 2.9. Hence, the
smaller the error values for each model, the better is the fit for the obtained adsorption
data except for R
2 which indicates goodness of fit if its value is closer to unity. The
slope and intercept of the linear plot of t/q t versus t give the values of q e and K 2
respectively.
It was observed in Table 2.4 that the q e values for the experimental and the
predicted for the pseudo-second-order kinetics are very close, indicating good agreement. For the pseudo-first-order kinetics, the q e values were observed to be not in
agreement with one another. Also, for both first- and second-order kinetics, their
adsorption capacity (q e ) was found to increase with increase in metal ion concentration. The smaller MPSD values observed (0.53–1.99) for the pseudo-second-order
kinetic model indicates unique agreement and goodness of fit. Likewise, the high