

34
2 Thermodynamics, Kinetics and Desorption Studies …
Table 2.1 BET surface area,
pore volume and pore size
values of CS, CR-CS and
G/CR-CS
Sample
Surface area
(m 2 /g)
Pore volume
(cm 3 /g)
Pore size (nm)
CS
190.0
0.406
41.102
CR-CS
156.2
0.309
34.321
G/CR-CS
237.4
0.503
57.283
The results also show that cross-linking decreases the surface area, pore volume
and pore sizes when compared to pure chitosan, and this may be because of the
involvement of hydroxyl group in the cross-linking reaction.
2.4.2.2 TGA Outcome
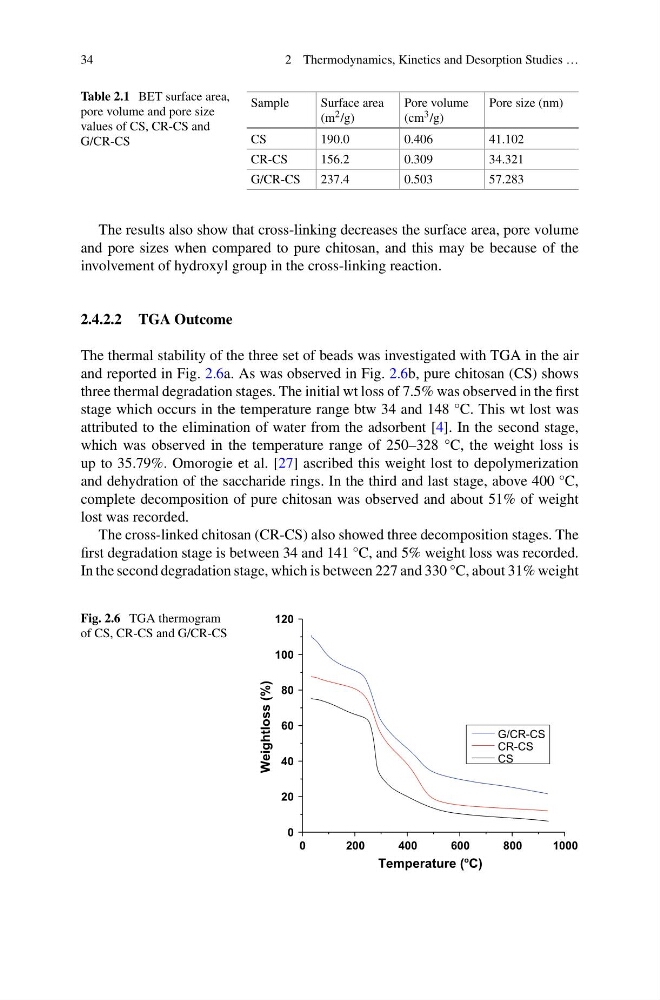
The thermal stability of the three set of beads was investigated with TGA in the air
and reported in Fig. 2.6a. As was observed in Fig. 2.6b, pure chitosan (CS) shows
three thermal degradation stages. The initial wt loss of 7.5% was observed in the first
stage which occurs in the temperature range btw 34 and 148 °C. This wt lost was
attributed to the elimination of water from the adsorbent [4]. In the second stage,
which was observed in the temperature range of 250–328 °C, the weight loss is
up to 35.79%. Omorogie et al. [27] ascribed this weight lost to depolymerization
and dehydration of the saccharide rings. In the third and last stage, above 400 °C,
complete decomposition of pure chitosan was observed and about 51% of weight
lost was recorded.
The cross-linked chitosan (CR-CS) also showed three decomposition stages. The
first degradation stage is between 34 and 141 °C, and 5% weight loss was recorded.
In the second degradation stage, which is between 227 and 330 °C, about 31% weight
Fig. 2.6 TGA thermogram
of CS, CR-CS and G/CR-CS
0
200
400
600
800
1000
0
20
40
60
80
100
120
Weightloss (%)
Temperature (
o C)
G/CR-CS
CR-CS
CS
2 Thermodynamics, Kinetics and Desorption Studies …
Table 2.1 BET surface area,
pore volume and pore size
values of CS, CR-CS and
G/CR-CS
Sample
Surface area
(m 2 /g)
Pore volume
(cm 3 /g)
Pore size (nm)
CS
190.0
0.406
41.102
CR-CS
156.2
0.309
34.321
G/CR-CS
237.4
0.503
57.283
The results also show that cross-linking decreases the surface area, pore volume
and pore sizes when compared to pure chitosan, and this may be because of the
involvement of hydroxyl group in the cross-linking reaction.
2.4.2.2 TGA Outcome
The thermal stability of the three set of beads was investigated with TGA in the air
and reported in Fig. 2.6a. As was observed in Fig. 2.6b, pure chitosan (CS) shows
three thermal degradation stages. The initial wt loss of 7.5% was observed in the first
stage which occurs in the temperature range btw 34 and 148 °C. This wt lost was
attributed to the elimination of water from the adsorbent [4]. In the second stage,
which was observed in the temperature range of 250–328 °C, the weight loss is
up to 35.79%. Omorogie et al. [27] ascribed this weight lost to depolymerization
and dehydration of the saccharide rings. In the third and last stage, above 400 °C,
complete decomposition of pure chitosan was observed and about 51% of weight
lost was recorded.
The cross-linked chitosan (CR-CS) also showed three decomposition stages. The
first degradation stage is between 34 and 141 °C, and 5% weight loss was recorded.
In the second degradation stage, which is between 227 and 330 °C, about 31% weight
Fig. 2.6 TGA thermogram
of CS, CR-CS and G/CR-CS
0
200
400
600
800
1000
0
20
40
60
80
100
120
Weightloss (%)
Temperature (
o C)
G/CR-CS
CR-CS
CS