

62
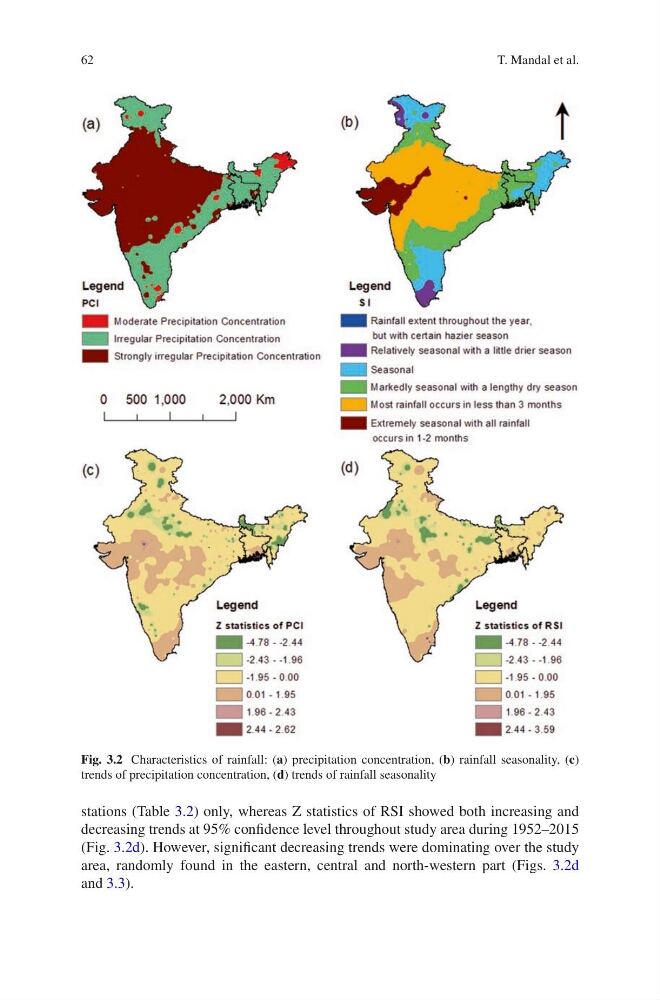
stations (Table 3.2) only, whereas Z statistics of RSI showed both increasing and
decreasing trends at 95% confidence level throughout study area during 1952–2015
(Fig. 3.2d). However, significant decreasing trends were dominating over the study
area, randomly found in the eastern, central and north-western part (Figs. 3.2d
and 3.3).
Fig. 3.2 Characteristics of rainfall: (a) precipitation concentration, (b) rainfall seasonality, (c)
trends of precipitation concentration, (d) trends of rainfall seasonality
T. Mandal et al.
stations (Table 3.2) only, whereas Z statistics of RSI showed both increasing and
decreasing trends at 95% confidence level throughout study area during 1952–2015
(Fig. 3.2d). However, significant decreasing trends were dominating over the study
area, randomly found in the eastern, central and north-western part (Figs. 3.2d
and 3.3).
Fig. 3.2 Characteristics of rainfall: (a) precipitation concentration, (b) rainfall seasonality, (c)
trends of precipitation concentration, (d) trends of rainfall seasonality
T. Mandal et al.