

60
3.3.6 Modified Mann-Kendall Test
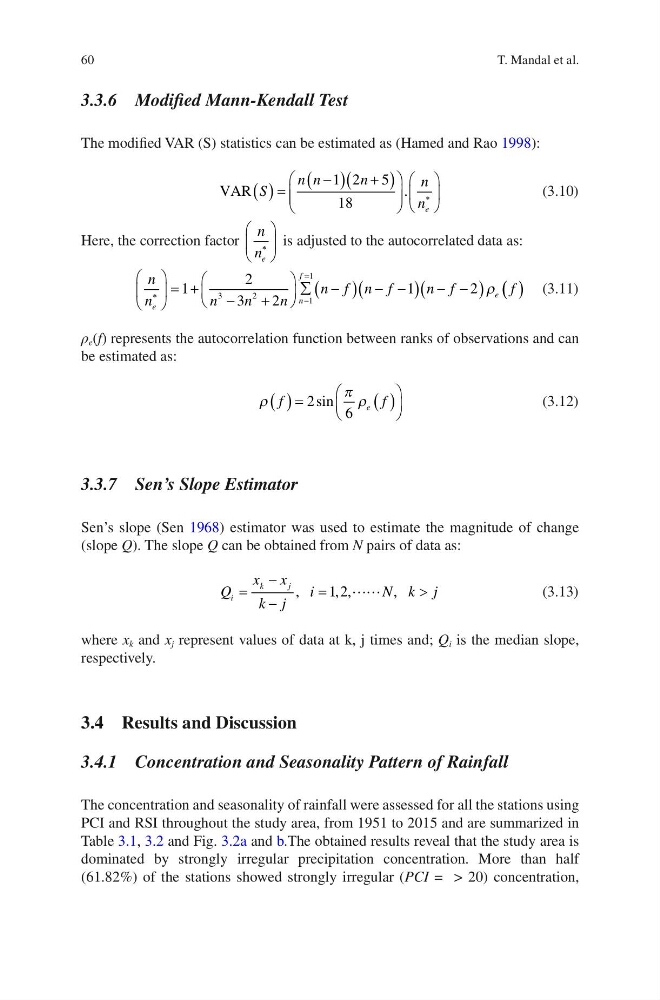
The modified VAR (S) statistics can be estimated as (Hamed and Rao 1998):
VAR S
n n
n
n
n e
§
©
¨ ¨
·
¹
¸ ¸
§
©
¨
·
¹
¸
1 2 5
18
.
(3.10)
Here, the correction factor
n
n e
§
©
¨
·
¹
¸ is adjusted to the autocorrelated data as:
n
n
n
n
n
n f n f
n f
f
e
n
f
e
§
©
¨
·
¹
¸
§
©
¨
·
¹
¸ ¦
1
2
3
2
1
2
3
2
1
1
U (3.11)
ρ e (f) represents the autocorrelation function between ranks of observations and can
be estimated as:
U
S U
f
f
e
§
©
¨
·
¹
¸
2
6
sin
(3.12)
3.3.7 Sen’s Slope Estimator
Sen’s slope (Sen 1968) estimator was used to estimate the magnitude of change
(slope Q). The slope Q can be obtained from N pairs of data as:
Q
x x
k j
i
N k j
i
k
j
!
,
, ,
,
1 2
(3.13)
where x k and x j represent values of data at k, j times and; Q i is the median slope,
respectively.
3.4 Results and Discussion
3.4.1 Concentration and Seasonality Pattern of Rainfall
The concentration and seasonality of rainfall were assessed for all the stations using
PCI and RSI throughout the study area, from 1951 to 2015 and are summarized in
Table 3.1, 3.2 and Fig. 3.2a and b.The obtained results reveal that the study area is
dominated by strongly irregular precipitation concentration. More than half
(61.82%) of the stations showed strongly irregular (PCI = > 20) concentration,
T. Mandal et al.
3.3.6 Modified Mann-Kendall Test
The modified VAR (S) statistics can be estimated as (Hamed and Rao 1998):
VAR S
n n
n
n
n e
§
©
¨ ¨
·
¹
¸ ¸
§
©
¨
·
¹
¸
1 2 5
18
.
(3.10)
Here, the correction factor
n
n e
§
©
¨
·
¹
¸ is adjusted to the autocorrelated data as:
n
n
n
n
n
n f n f
n f
f
e
n
f
e
§
©
¨
·
¹
¸
§
©
¨
·
¹
¸ ¦
1
2
3
2
1
2
3
2
1
1
U (3.11)
ρ e (f) represents the autocorrelation function between ranks of observations and can
be estimated as:
U
S U
f
f
e
§
©
¨
·
¹
¸
2
6
sin
(3.12)
3.3.7 Sen’s Slope Estimator
Sen’s slope (Sen 1968) estimator was used to estimate the magnitude of change
(slope Q). The slope Q can be obtained from N pairs of data as:
Q
x x
k j
i
N k j
i
k
j
!
,
, ,
,
1 2
(3.13)
where x k and x j represent values of data at k, j times and; Q i is the median slope,
respectively.
3.4 Results and Discussion
3.4.1 Concentration and Seasonality Pattern of Rainfall
The concentration and seasonality of rainfall were assessed for all the stations using
PCI and RSI throughout the study area, from 1951 to 2015 and are summarized in
Table 3.1, 3.2 and Fig. 3.2a and b.The obtained results reveal that the study area is
dominated by strongly irregular precipitation concentration. More than half
(61.82%) of the stations showed strongly irregular (PCI = > 20) concentration,
T. Mandal et al.