

20
2017 and contributed 2467 million tons of CO 2 which was approximately 6.8% of
the total global emission. In terms of per capita CO 2 emission India ranked 159 out
of 251 countries and accounted for 1.73 metric tons per capita emission in 2014
(World Bank last updated on 19.12.2019). As a growing economy, the per capita
CO 2 emission of India is low compared to other countries. India has promised to
reduce 33–35% of CO 2 emission for per unit of GDP with respect to its emission on
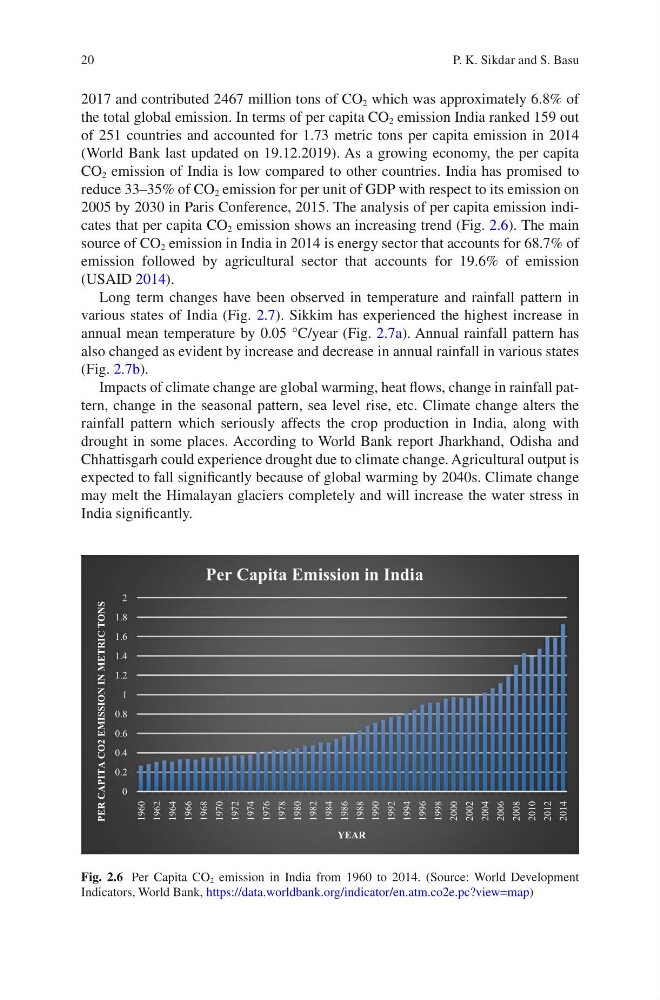
2005 by 2030 in Paris Conference, 2015. The analysis of per capita emission indicates that per capita CO 2 emission shows an increasing trend (Fig. 2.6). The main
source of CO 2 emission in India in 2014 is energy sector that accounts for 68.7% of
emission followed by agricultural sector that accounts for 19.6% of emission
(USAID 2014).
Long term changes have been observed in temperature and rainfall pattern in
various states of India (Fig. 2.7). Sikkim has experienced the highest increase in
annual mean temperature by 0.05 °C/year (Fig. 2.7a). Annual rainfall pattern has
also changed as evident by increase and decrease in annual rainfall in various states
(Fig. 2.7b).
Impacts of climate change are global warming, heat flows, change in rainfall pattern, change in the seasonal pattern, sea level rise, etc. Climate change alters the
rainfall pattern which seriously affects the crop production in India, along with
drought in some places. According to World Bank report Jharkhand, Odisha and
Chhattisgarh could experience drought due to climate change. Agricultural output is
expected to fall significantly because of global warming by 2040s. Climate change
may melt the Himalayan glaciers completely and will increase the water stress in
India significantly.
0
0.2
0.4
0.6
0.8
1
1.2
1.4
1.6
1.8
2
1960
1962
1964
1966
1968
1970
1972
1974
1976
1978
1980
1982
1984
1986
1988
1990
1992
1994
1996
1998
2000
2002
2004
2006
2008
2010
2012
2014
PER CAPITA CO2 EMISSION IN METRIC TONS
YEAR
Per Capita Emission in India
Fig. 2.6 Per Capita CO 2 emission in India from 1960 to 2014. (Source: World Development
Indicators, World Bank, https://data.worldbank.org/indicator/en.atm.co2e.pc?view=map)
P. K. Sikdar and S. Basu
2017 and contributed 2467 million tons of CO 2 which was approximately 6.8% of
the total global emission. In terms of per capita CO 2 emission India ranked 159 out
of 251 countries and accounted for 1.73 metric tons per capita emission in 2014
(World Bank last updated on 19.12.2019). As a growing economy, the per capita
CO 2 emission of India is low compared to other countries. India has promised to
reduce 33–35% of CO 2 emission for per unit of GDP with respect to its emission on
2005 by 2030 in Paris Conference, 2015. The analysis of per capita emission indicates that per capita CO 2 emission shows an increasing trend (Fig. 2.6). The main
source of CO 2 emission in India in 2014 is energy sector that accounts for 68.7% of
emission followed by agricultural sector that accounts for 19.6% of emission
(USAID 2014).
Long term changes have been observed in temperature and rainfall pattern in
various states of India (Fig. 2.7). Sikkim has experienced the highest increase in
annual mean temperature by 0.05 °C/year (Fig. 2.7a). Annual rainfall pattern has
also changed as evident by increase and decrease in annual rainfall in various states
(Fig. 2.7b).
Impacts of climate change are global warming, heat flows, change in rainfall pattern, change in the seasonal pattern, sea level rise, etc. Climate change alters the
rainfall pattern which seriously affects the crop production in India, along with
drought in some places. According to World Bank report Jharkhand, Odisha and
Chhattisgarh could experience drought due to climate change. Agricultural output is
expected to fall significantly because of global warming by 2040s. Climate change
may melt the Himalayan glaciers completely and will increase the water stress in
India significantly.
0
0.2
0.4
0.6
0.8
1
1.2
1.4
1.6
1.8
2
1960
1962
1964
1966
1968
1970
1972
1974
1976
1978
1980
1982
1984
1986
1988
1990
1992
1994
1996
1998
2000
2002
2004
2006
2008
2010
2012
2014
PER CAPITA CO2 EMISSION IN METRIC TONS
YEAR
Per Capita Emission in India
Fig. 2.6 Per Capita CO 2 emission in India from 1960 to 2014. (Source: World Development
Indicators, World Bank, https://data.worldbank.org/indicator/en.atm.co2e.pc?view=map)
P. K. Sikdar and S. Basu