

314
18.8 Present Scenario
The Global E-waste Monitor (2017) provided a glimpse of the situation. The annual
global consumption of new electrical and electronic equipment was around 60 million metric tonnes (Mt), while 44.7 Mt. of E-waste was generated 6.1 kg/inhabitant
in 2016. E-waste is expected to reach an astonishing figure of 52.2 Mt. with 6.8 kg/
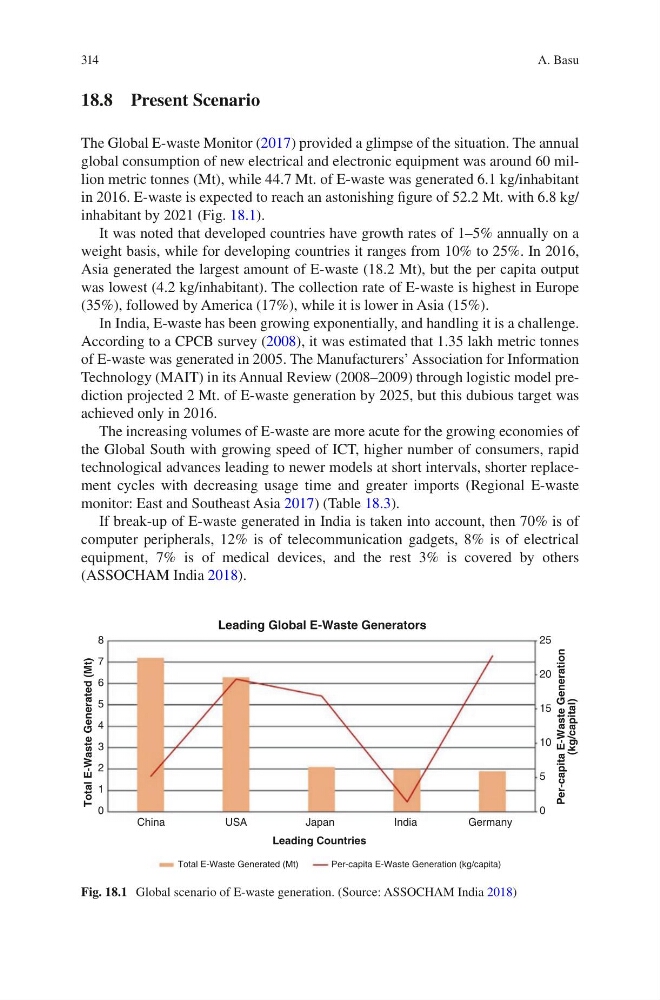
inhabitant by 2021 (Fig. 18.1).
It was noted that developed countries have growth rates of 1–5% annually on a
weight basis, while for developing countries it ranges from 10% to 25%. In 2016,
Asia generated the largest amount of E-waste (18.2 Mt), but the per capita output
was lowest (4.2 kg/inhabitant). The collection rate of E-waste is highest in Europe
(35%), followed by America (17%), while it is lower in Asia (15%).
In India, E-waste has been growing exponentially, and handling it is a challenge.
According to a CPCB survey (2008), it was estimated that 1.35 lakh metric tonnes
of E-waste was generated in 2005. The Manufacturers’ Association for Information
Technology (MAIT) in its Annual Review (2008–2009) through logistic model prediction projected 2 Mt. of E-waste generation by 2025, but this dubious target was
achieved only in 2016.
The increasing volumes of E-waste are more acute for the growing economies of
the Global South with growing speed of ICT, higher number of consumers, rapid
technological advances leading to newer models at short intervals, shorter replacement cycles with decreasing usage time and greater imports (Regional E-waste
monitor: East and Southeast Asia 2017) (Table 18.3).
If break-up of E-waste generated in India is taken into account, then 70% is of
computer peripherals, 12% is of telecommunication gadgets, 8% is of electrical
equipment, 7% is of medical devices, and the rest 3% is covered by others
(ASSOCHAM India 2018).
8
7
6
5
Total E-Waste Generated (Mt)
Per-capita E-Waste Generation
(kg/capital)
Leading Countries
Leading Global E-Waste Generators
4
3
2
1
0
25
20
15
10
5
0
China
USA
Total E-Waste Generated (Mt)
Per-capita E-Waste Generation (kg/capita)
Japan
India
G ermany
Fig. 18.1 Global scenario of E-waste generation. (Source: ASSOCHAM India 2018)
A. Basu
18.8 Present Scenario
The Global E-waste Monitor (2017) provided a glimpse of the situation. The annual
global consumption of new electrical and electronic equipment was around 60 million metric tonnes (Mt), while 44.7 Mt. of E-waste was generated 6.1 kg/inhabitant
in 2016. E-waste is expected to reach an astonishing figure of 52.2 Mt. with 6.8 kg/
inhabitant by 2021 (Fig. 18.1).
It was noted that developed countries have growth rates of 1–5% annually on a
weight basis, while for developing countries it ranges from 10% to 25%. In 2016,
Asia generated the largest amount of E-waste (18.2 Mt), but the per capita output
was lowest (4.2 kg/inhabitant). The collection rate of E-waste is highest in Europe
(35%), followed by America (17%), while it is lower in Asia (15%).
In India, E-waste has been growing exponentially, and handling it is a challenge.
According to a CPCB survey (2008), it was estimated that 1.35 lakh metric tonnes
of E-waste was generated in 2005. The Manufacturers’ Association for Information
Technology (MAIT) in its Annual Review (2008–2009) through logistic model prediction projected 2 Mt. of E-waste generation by 2025, but this dubious target was
achieved only in 2016.
The increasing volumes of E-waste are more acute for the growing economies of
the Global South with growing speed of ICT, higher number of consumers, rapid
technological advances leading to newer models at short intervals, shorter replacement cycles with decreasing usage time and greater imports (Regional E-waste
monitor: East and Southeast Asia 2017) (Table 18.3).
If break-up of E-waste generated in India is taken into account, then 70% is of
computer peripherals, 12% is of telecommunication gadgets, 8% is of electrical
equipment, 7% is of medical devices, and the rest 3% is covered by others
(ASSOCHAM India 2018).
8
7
6
5
Total E-Waste Generated (Mt)
Per-capita E-Waste Generation
(kg/capital)
Leading Countries
Leading Global E-Waste Generators
4
3
2
1
0
25
20
15
10
5
0
China
USA
Total E-Waste Generated (Mt)
Per-capita E-Waste Generation (kg/capita)
Japan
India
G ermany
Fig. 18.1 Global scenario of E-waste generation. (Source: ASSOCHAM India 2018)
A. Basu