

266
However the articles which come out recently (e.g., Ghosh 2016, 2019) highlight
only the nature and simulation of drought of Purulia, and hardly any research tries
to explore the drought-induced migration scenarios of Purulia. This research tries to
explore the drought-induced livelihood turmoil and as a result human migration of
Purulia District.
15.3 Data Sources and Methodology
Rainfall data for Purulia District within the time frame 2001–2011 has been downloaded from CFSR reanalysis dataset, and it is used to estimate SPI. Drainage density maps have been prepared using ASTERGDEM 2011 downloaded from Earth
Explorer. Required census data was collected from census of India website for 2001
and 2011, and District Statistical Handbook is collected from Panchayat Bhawan,
Salt Lake City, and Kolkata. All secondary data is available freely on Internet.
Primary survey carried forward in 2016–2017 session to estimate the migration.
15.3.1 Estimation of Standard Precipitation Index (SPI)
and Drainage Density (DD)
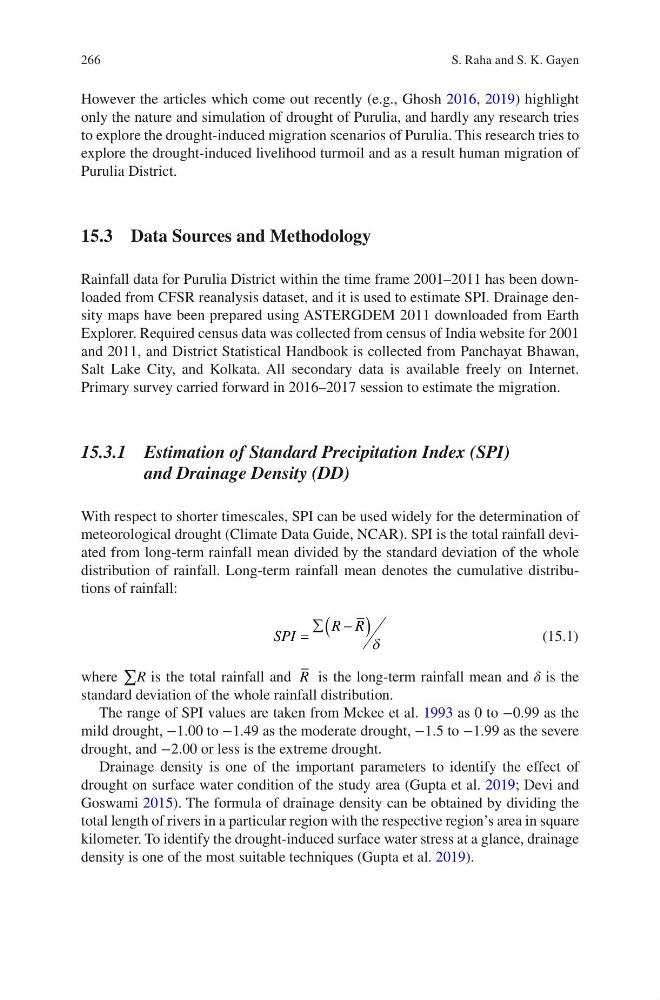
With respect to shorter timescales, SPI can be used widely for the determination of
meteorological drought (Climate Data Guide, NCAR). SPI is the total rainfall deviated from long-term rainfall mean divided by the standard deviation of the whole
distribution of rainfall. Long-term rainfall mean denotes the cumulative distributions of rainfall:
SPI
R R
=
∑ −
(
)
δ
(15.1)
where ∑R is the total rainfall and R is the long-term rainfall mean and δ is the
standard deviation of the whole rainfall distribution.
The range of SPI values are taken from Mckee et al. 1993 as 0 to −0.99 as the
mild drought, −1.00 to −1.49 as the moderate drought, −1.5 to −1.99 as the severe
drought, and −2.00 or less is the extreme drought.
Drainage density is one of the important parameters to identify the effect of
drought on surface water condition of the study area (Gupta et al. 2019; Devi and
Goswami 2015). The formula of drainage density can be obtained by dividing the
total length of rivers in a particular region with the respective region’s area in square
kilometer. To identify the drought-induced surface water stress at a glance, drainage
density is one of the most suitable techniques (Gupta et al. 2019).
S. Raha and S. K. Gayen
However the articles which come out recently (e.g., Ghosh 2016, 2019) highlight
only the nature and simulation of drought of Purulia, and hardly any research tries
to explore the drought-induced migration scenarios of Purulia. This research tries to
explore the drought-induced livelihood turmoil and as a result human migration of
Purulia District.
15.3 Data Sources and Methodology
Rainfall data for Purulia District within the time frame 2001–2011 has been downloaded from CFSR reanalysis dataset, and it is used to estimate SPI. Drainage density maps have been prepared using ASTERGDEM 2011 downloaded from Earth
Explorer. Required census data was collected from census of India website for 2001
and 2011, and District Statistical Handbook is collected from Panchayat Bhawan,
Salt Lake City, and Kolkata. All secondary data is available freely on Internet.
Primary survey carried forward in 2016–2017 session to estimate the migration.
15.3.1 Estimation of Standard Precipitation Index (SPI)
and Drainage Density (DD)
With respect to shorter timescales, SPI can be used widely for the determination of
meteorological drought (Climate Data Guide, NCAR). SPI is the total rainfall deviated from long-term rainfall mean divided by the standard deviation of the whole
distribution of rainfall. Long-term rainfall mean denotes the cumulative distributions of rainfall:
SPI
R R
=
∑ −
(
)
δ
(15.1)
where ∑R is the total rainfall and R is the long-term rainfall mean and δ is the
standard deviation of the whole rainfall distribution.
The range of SPI values are taken from Mckee et al. 1993 as 0 to −0.99 as the
mild drought, −1.00 to −1.49 as the moderate drought, −1.5 to −1.99 as the severe
drought, and −2.00 or less is the extreme drought.
Drainage density is one of the important parameters to identify the effect of
drought on surface water condition of the study area (Gupta et al. 2019; Devi and
Goswami 2015). The formula of drainage density can be obtained by dividing the
total length of rivers in a particular region with the respective region’s area in square
kilometer. To identify the drought-induced surface water stress at a glance, drainage
density is one of the most suitable techniques (Gupta et al. 2019).
S. Raha and S. K. Gayen