

257
index using yearly total crop production data (in thousand tones) for the districts
Bankura, Purulia, Purba Medinipur, and Paschim Medinipur. In this graph
1999–2000, 2000–2001, 2002–2003, 2003–2004, 2005–2006, and 2010–2011 YAI
have negative values in comparison to other years. 2000–2001, 2003–2004,
2010–2011 indicate severe drought condition because of negative YAI values beyond.
1.00. Those years correspond with the drought affected years identified through
VCI and RAI calculations.
14.5 Conclusion
The present study thus has been able to successfully identify the drought prone
regions of the different districts of western part of West Bengal through remote
sensing-based image analysis. VCI, RAI, and YAI were applied on the remotely
sensed datasets to derive vegetation condition, rainfall deficits, and yield anomaly
from crop production attribute data, respectively. The latter helped in substantiating
the agricultural drought-affected years and zones derived from the former. It was
proved that the metrological drought inevitably resulted in agricultural drought in
the region. In the year 2000–2001, 2010–2011 severe drought was observed because
the VCI value found was very low (below 35%). In agreement to that, it was found
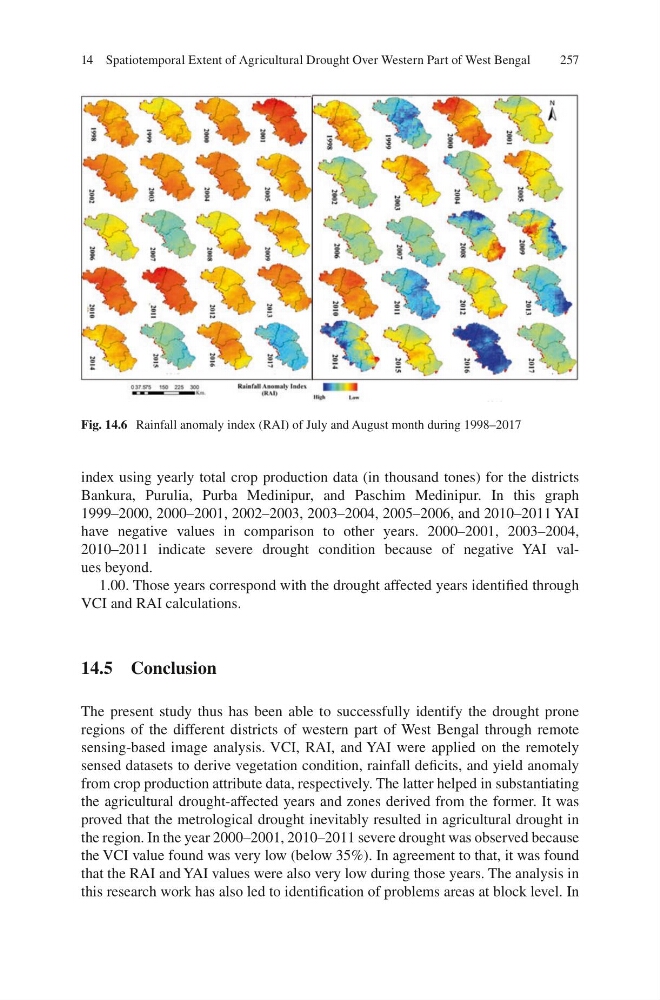
that the RAI and YAI values were also very low during those years. The analysis in
this research work has also led to identification of problems areas at block level. In
Fig. 14.6 Rainfall anomaly index (RAI) of July and August month during 1998–2017
14 Spatiotemporal Extent of Agricultural Drought Over Western Part of West Bengal
index using yearly total crop production data (in thousand tones) for the districts
Bankura, Purulia, Purba Medinipur, and Paschim Medinipur. In this graph
1999–2000, 2000–2001, 2002–2003, 2003–2004, 2005–2006, and 2010–2011 YAI
have negative values in comparison to other years. 2000–2001, 2003–2004,
2010–2011 indicate severe drought condition because of negative YAI values beyond.
1.00. Those years correspond with the drought affected years identified through
VCI and RAI calculations.
14.5 Conclusion
The present study thus has been able to successfully identify the drought prone
regions of the different districts of western part of West Bengal through remote
sensing-based image analysis. VCI, RAI, and YAI were applied on the remotely
sensed datasets to derive vegetation condition, rainfall deficits, and yield anomaly
from crop production attribute data, respectively. The latter helped in substantiating
the agricultural drought-affected years and zones derived from the former. It was
proved that the metrological drought inevitably resulted in agricultural drought in
the region. In the year 2000–2001, 2010–2011 severe drought was observed because
the VCI value found was very low (below 35%). In agreement to that, it was found
that the RAI and YAI values were also very low during those years. The analysis in
this research work has also led to identification of problems areas at block level. In
Fig. 14.6 Rainfall anomaly index (RAI) of July and August month during 1998–2017
14 Spatiotemporal Extent of Agricultural Drought Over Western Part of West Bengal