

175
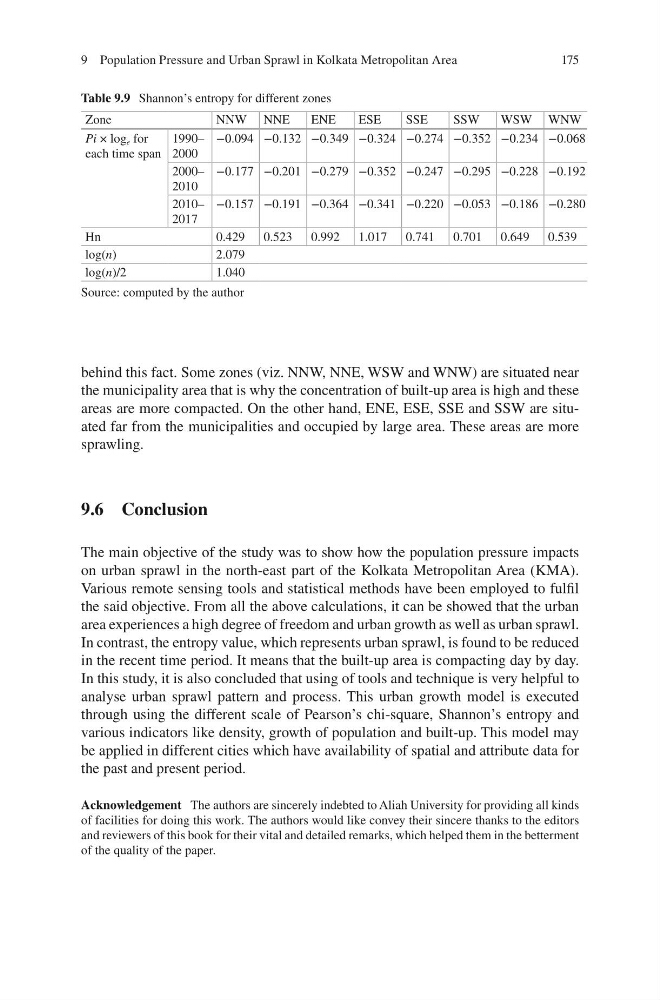
behind this fact. Some zones (viz. NNW, NNE, WSW and WNW) are situated near
the municipality area that is why the concentration of built-up area is high and these
areas are more compacted. On the other hand, ENE, ESE, SSE and SSW are situated far from the municipalities and occupied by large area. These areas are more
sprawling.
9.6 Conclusion
The main objective of the study was to show how the population pressure impacts
on urban sprawl in the north-east part of the Kolkata Metropolitan Area (KMA).
Various remote sensing tools and statistical methods have been employed to fulfil
the said objective. From all the above calculations, it can be showed that the urban
area experiences a high degree of freedom and urban growth as well as urban sprawl.
In contrast, the entropy value, which represents urban sprawl, is found to be reduced
in the recent time period. It means that the built-up area is compacting day by day.
In this study, it is also concluded that using of tools and technique is very helpful to
analyse urban sprawl pattern and process. This urban growth model is executed
through using the different scale of Pearson’s chi-square, Shannon’s entropy and
various indicators like density, growth of population and built-up. This model may
be applied in different cities which have availability of spatial and attribute data for
the past and present period.
Acknowledgement The authors are sincerely indebted to Aliah University for providing all kinds
of facilities for doing this work. The authors would like convey their sincere thanks to the editors
and reviewers of this book for their vital and detailed remarks, which helped them in the betterment
of the quality of the paper.
Table 9.9 Shannon’s entropy for different zones
Zone
NNW NNE
ENE
ESE
SSE
SSW
WSW WNW
Pi × log e for
each time span
1990–
2000
−0.094 −0.132 −0.349 −0.324 −0.274 −0.352 −0.234 −0.068
2000–
2010
−0.177 −0.201 −0.279 −0.352 −0.247 −0.295 −0.228 −0.192
2010–
2017
−0.157 −0.191 −0.364 −0.341 −0.220 −0.053 −0.186 −0.280
Hn
0.429 0.523 0.992 1.017 0.741 0.701 0.649 0.539
log(n)
2.079
log(n)/2
1.040
Source: computed by the author
9 Population Pressure and Urban Sprawl in Kolkata Metropolitan Area
behind this fact. Some zones (viz. NNW, NNE, WSW and WNW) are situated near
the municipality area that is why the concentration of built-up area is high and these
areas are more compacted. On the other hand, ENE, ESE, SSE and SSW are situated far from the municipalities and occupied by large area. These areas are more
sprawling.
9.6 Conclusion
The main objective of the study was to show how the population pressure impacts
on urban sprawl in the north-east part of the Kolkata Metropolitan Area (KMA).
Various remote sensing tools and statistical methods have been employed to fulfil
the said objective. From all the above calculations, it can be showed that the urban
area experiences a high degree of freedom and urban growth as well as urban sprawl.
In contrast, the entropy value, which represents urban sprawl, is found to be reduced
in the recent time period. It means that the built-up area is compacting day by day.
In this study, it is also concluded that using of tools and technique is very helpful to
analyse urban sprawl pattern and process. This urban growth model is executed
through using the different scale of Pearson’s chi-square, Shannon’s entropy and
various indicators like density, growth of population and built-up. This model may
be applied in different cities which have availability of spatial and attribute data for
the past and present period.
Acknowledgement The authors are sincerely indebted to Aliah University for providing all kinds
of facilities for doing this work. The authors would like convey their sincere thanks to the editors
and reviewers of this book for their vital and detailed remarks, which helped them in the betterment
of the quality of the paper.
Table 9.9 Shannon’s entropy for different zones
Zone
NNW NNE
ENE
ESE
SSE
SSW
WSW WNW
Pi × log e for
each time span
1990–
2000
−0.094 −0.132 −0.349 −0.324 −0.274 −0.352 −0.234 −0.068
2000–
2010
−0.177 −0.201 −0.279 −0.352 −0.247 −0.295 −0.228 −0.192
2010–
2017
−0.157 −0.191 −0.364 −0.341 −0.220 −0.053 −0.186 −0.280
Hn
0.429 0.523 0.992 1.017 0.741 0.701 0.649 0.539
log(n)
2.079
log(n)/2
1.040
Source: computed by the author
9 Population Pressure and Urban Sprawl in Kolkata Metropolitan Area