

Advances in Neural Signal Processing
38
3.2 Variations in torque allow to differentiate male and female gait
Lower body torque amplitude of male and female were analysed and compared
during swing and stance from frontal plane. Torque amplitude of hip and ankle
of female joints in the frontal plane showed more activity than the male in frontal
plane (Figure 3).
3.3 Temporal and spectral EEG features of gait
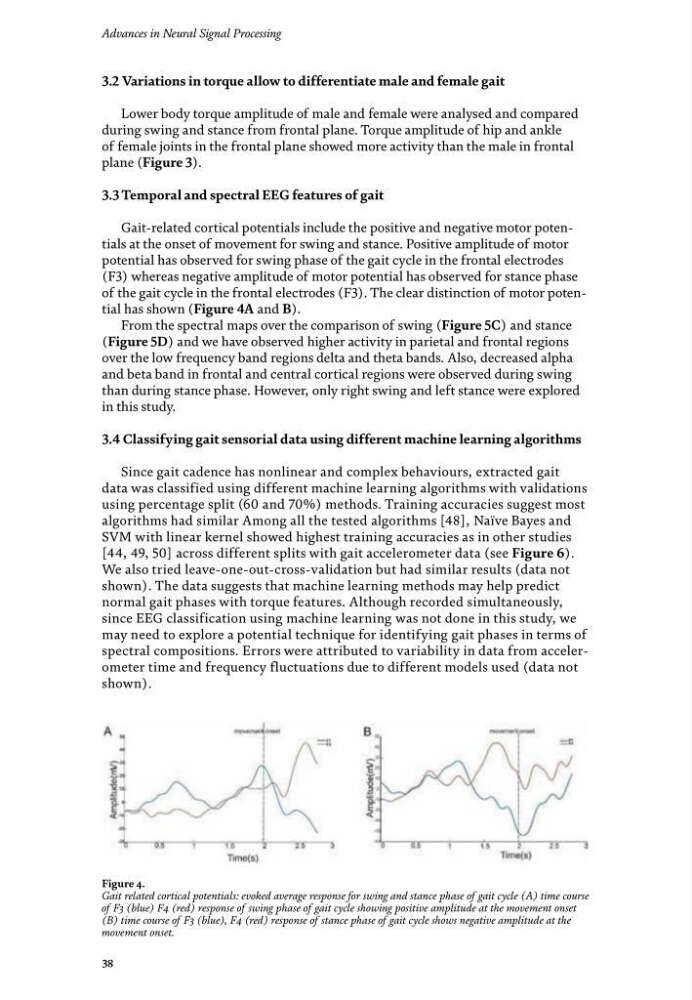
Gait-related cortical potentials include the positive and negative motor potentials at the onset of movement for swing and stance. Positive amplitude of motor
potential has observed for swing phase of the gait cycle in the frontal electrodes
(F3) whereas negative amplitude of motor potential has observed for stance phase
of the gait cycle in the frontal electrodes (F3). The clear distinction of motor potential has shown (Figure 4A and B).
From the spectral maps over the comparison of swing (Figure 5C) and stance
(Figure 5D) and we have observed higher activity in parietal and frontal regions
over the low frequency band regions delta and theta bands. Also, decreased alpha
and beta band in frontal and central cortical regions were observed during swing
than during stance phase. However, only right swing and left stance were explored
in this study.
3.4 Classifying gait sensorial data using different machine learning algorithms
Since gait cadence has nonlinear and complex behaviours, extracted gait
data was classified using different machine learning algorithms with validations
using percentage split (60 and 70%) methods. Training accuracies suggest most
algorithms had similar Among all the tested algorithms [48], Naïve Bayes and
SVM with linear kernel showed highest training accuracies as in other studies
[44, 49, 50] across different splits with gait accelerometer data (see Figure 6).
We also tried leave-one-out-cross-validation but had similar results (data not
shown). The data suggests that machine learning methods may help predict
normal gait phases with torque features. Although recorded simultaneously,
since EEG classification using machine learning was not done in this study, we
may need to explore a potential technique for identifying gait phases in terms of
spectral compositions. Errors were attributed to variability in data from accelerometer time and frequency fluctuations due to different models used (data not
shown).
Figure 4.
Gait related cortical potentials: evoked average response for swing and stance phase of gait cycle (A) time course
of F3 (blue) F4 (red) response of swing phase of gait cycle showing positive amplitude at the movement onset
(B) time course of F3 (blue), F4 (red) response of stance phase of gait cycle shows negative amplitude at the
movement onset.
38
3.2 Variations in torque allow to differentiate male and female gait
Lower body torque amplitude of male and female were analysed and compared
during swing and stance from frontal plane. Torque amplitude of hip and ankle
of female joints in the frontal plane showed more activity than the male in frontal
plane (Figure 3).
3.3 Temporal and spectral EEG features of gait
Gait-related cortical potentials include the positive and negative motor potentials at the onset of movement for swing and stance. Positive amplitude of motor
potential has observed for swing phase of the gait cycle in the frontal electrodes
(F3) whereas negative amplitude of motor potential has observed for stance phase
of the gait cycle in the frontal electrodes (F3). The clear distinction of motor potential has shown (Figure 4A and B).
From the spectral maps over the comparison of swing (Figure 5C) and stance
(Figure 5D) and we have observed higher activity in parietal and frontal regions
over the low frequency band regions delta and theta bands. Also, decreased alpha
and beta band in frontal and central cortical regions were observed during swing
than during stance phase. However, only right swing and left stance were explored
in this study.
3.4 Classifying gait sensorial data using different machine learning algorithms
Since gait cadence has nonlinear and complex behaviours, extracted gait
data was classified using different machine learning algorithms with validations
using percentage split (60 and 70%) methods. Training accuracies suggest most
algorithms had similar Among all the tested algorithms [48], Naïve Bayes and
SVM with linear kernel showed highest training accuracies as in other studies
[44, 49, 50] across different splits with gait accelerometer data (see Figure 6).
We also tried leave-one-out-cross-validation but had similar results (data not
shown). The data suggests that machine learning methods may help predict
normal gait phases with torque features. Although recorded simultaneously,
since EEG classification using machine learning was not done in this study, we
may need to explore a potential technique for identifying gait phases in terms of
spectral compositions. Errors were attributed to variability in data from accelerometer time and frequency fluctuations due to different models used (data not
shown).
Figure 4.
Gait related cortical potentials: evoked average response for swing and stance phase of gait cycle (A) time course
of F3 (blue) F4 (red) response of swing phase of gait cycle showing positive amplitude at the movement onset
(B) time course of F3 (blue), F4 (red) response of stance phase of gait cycle shows negative amplitude at the
movement onset.