

23
Cerebral Spectral Perturbation during Upper Limb Diagonal Movements
DOI: http://dx.doi.org/10.5772/intechopen.88337
3.2 Source localization
After observing modulation of theta, alpha, and beta frequency, we observed the
difference between diagonal and vertical movement in the generation of such frequency band activity in specific time windows (see Methods section for more details).
3.2.1 Theta
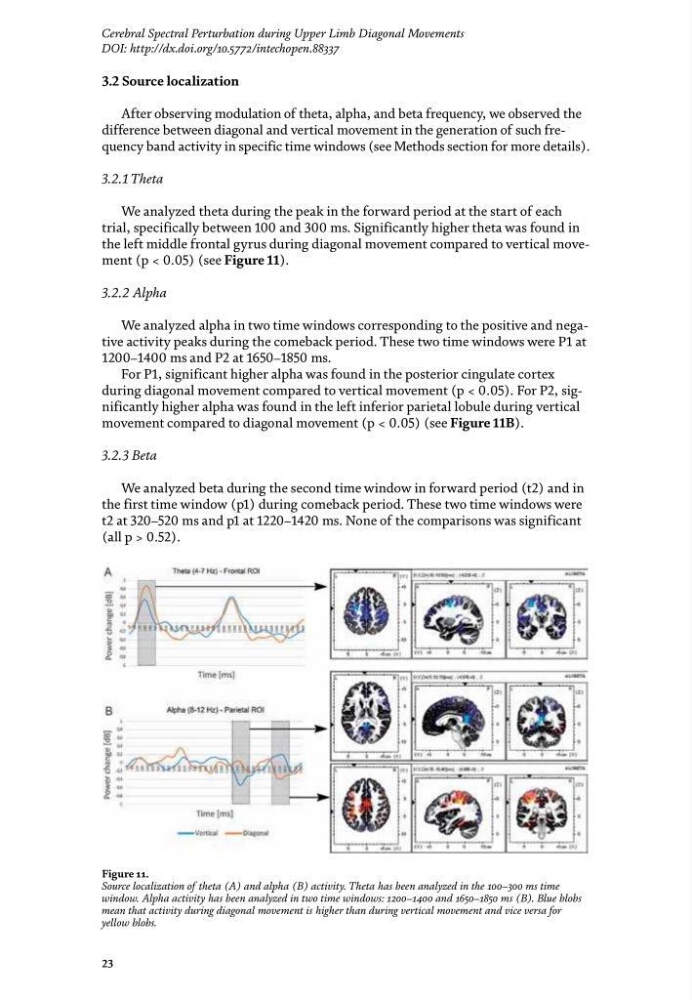
We analyzed theta during the peak in the forward period at the start of each
trial, specifically between 100 and 300 ms. Significantly higher theta was found in
the left middle frontal gyrus during diagonal movement compared to vertical movement (p < 0.05) (see Figure 11).
3.2.2 Alpha
We analyzed alpha in two time windows corresponding to the positive and negative activity peaks during the comeback period. These two time windows were P1 at
1200–1400 ms and P2 at 1650–1850 ms.
For P1, significant higher alpha was found in the posterior cingulate cortex
during diagonal movement compared to vertical movement (p < 0.05). For P2, significantly higher alpha was found in the left inferior parietal lobule during vertical
movement compared to diagonal movement (p < 0.05) (see Figure 11B).
3.2.3 Beta
We analyzed beta during the second time window in forward period (t2) and in
the first time window (p1) during comeback period. These two time windows were
t2 at 320–520 ms and p1 at 1220–1420 ms. None of the comparisons was significant
(all p > 0.52).
Figure 11.
Source localization of theta (A) and alpha (B) activity. Theta has been analyzed in the 100–300 ms time
window. Alpha activity has been analyzed in two time windows: 1200–1400 and 1650–1850 ms (B). Blue blobs
mean that activity during diagonal movement is higher than during vertical movement and vice versa for
yellow blobs.
Cerebral Spectral Perturbation during Upper Limb Diagonal Movements
DOI: http://dx.doi.org/10.5772/intechopen.88337
3.2 Source localization
After observing modulation of theta, alpha, and beta frequency, we observed the
difference between diagonal and vertical movement in the generation of such frequency band activity in specific time windows (see Methods section for more details).
3.2.1 Theta
We analyzed theta during the peak in the forward period at the start of each
trial, specifically between 100 and 300 ms. Significantly higher theta was found in
the left middle frontal gyrus during diagonal movement compared to vertical movement (p < 0.05) (see Figure 11).
3.2.2 Alpha
We analyzed alpha in two time windows corresponding to the positive and negative activity peaks during the comeback period. These two time windows were P1 at
1200–1400 ms and P2 at 1650–1850 ms.
For P1, significant higher alpha was found in the posterior cingulate cortex
during diagonal movement compared to vertical movement (p < 0.05). For P2, significantly higher alpha was found in the left inferior parietal lobule during vertical
movement compared to diagonal movement (p < 0.05) (see Figure 11B).
3.2.3 Beta
We analyzed beta during the second time window in forward period (t2) and in
the first time window (p1) during comeback period. These two time windows were
t2 at 320–520 ms and p1 at 1220–1420 ms. None of the comparisons was significant
(all p > 0.52).
Figure 11.
Source localization of theta (A) and alpha (B) activity. Theta has been analyzed in the 100–300 ms time
window. Alpha activity has been analyzed in two time windows: 1200–1400 and 1650–1850 ms (B). Blue blobs
mean that activity during diagonal movement is higher than during vertical movement and vice versa for
yellow blobs.