

3
Introductory Chapter: Methods and Applications of Neural Signal Processing
DOI: http://dx.doi.org/10.5772/intechopen.93335
3. Neural signal processing
3.1 Spike sorting
Spikes from closer neurons produce larger amplitude deflections in the recorded
signal. The goal of signal processing methods for such an input signal is to reliably
isolate and extract the spikes being emitted by a single neuron per recording electrode.
This procedure is usually called spike sorting. The simplest spike sorting method is to
classify spikes according to their peak amplitude. Sometimes, the peak amplitudes may
be the same for different neurons, making the method not feasible. A better approach
is the window discriminator method in which the experimenter visually examines the
data and places windows on aligned recordings of spikes of the same shape. The recent
trend has been toward clustering spikes automatically into groups based on shape,
where each group corresponds to spikes from one neuron. The shape of a spike is characterized by features extracted using wavelets or dimensionality reduction techniques.
3.2 Temporal and spatial feature extraction
Key temporal and spatial features can represent and help us understand the
neural activity from the underlying oscillations. The neural signals recorded from
the brain are typically mixture potentials resulting from network activity of a large
Electrical
recordings
Single-unit recordings (spikes)
Microelectrodes insert into neurons or
placed between adjacent neurons
Local field potential (LFP) recordings
Multielectrode arrays placed inside the
brain
Electrocorticography (ECoG)
Implanted electrodes placed on the
upper layers of cerebral cortex
Electroencephalography (EEG)
Electrodes placed on the surface of the
scalp
Magnetic
recordings
Magnetoencephalography (MEG)
Measures the magnetic field produced
by electrical activity in the brain
Neuroimaging
recordings
Functional near-infrared recordings
(fNIR)
Detects near-infrared light absorbance
of hemoglobin in the blood with/
without oxygen
Functional magnetic resonance
imaging (fMRI)
Measures the changes in oxygenated
and deoxygenated hemoglobin
concentrations in the blood
Positron emission tomography (PET)
Detects the radioactive compound as a
result of metabolic activity caused by
brain activity
Brain stimulations
Transcranial magnetic stimulation
(TMS)
Current-passed coil of wire paced next
to the skull to produce a rapidly change
magnetic field
Transcranial direct current stimulation
(tDCS)
Stimulates specific parts of the brain
using low-intensity direct electrical
currents
Deep brain stimulation (DBS)
Electrodes are implanted in target
regions of the brain
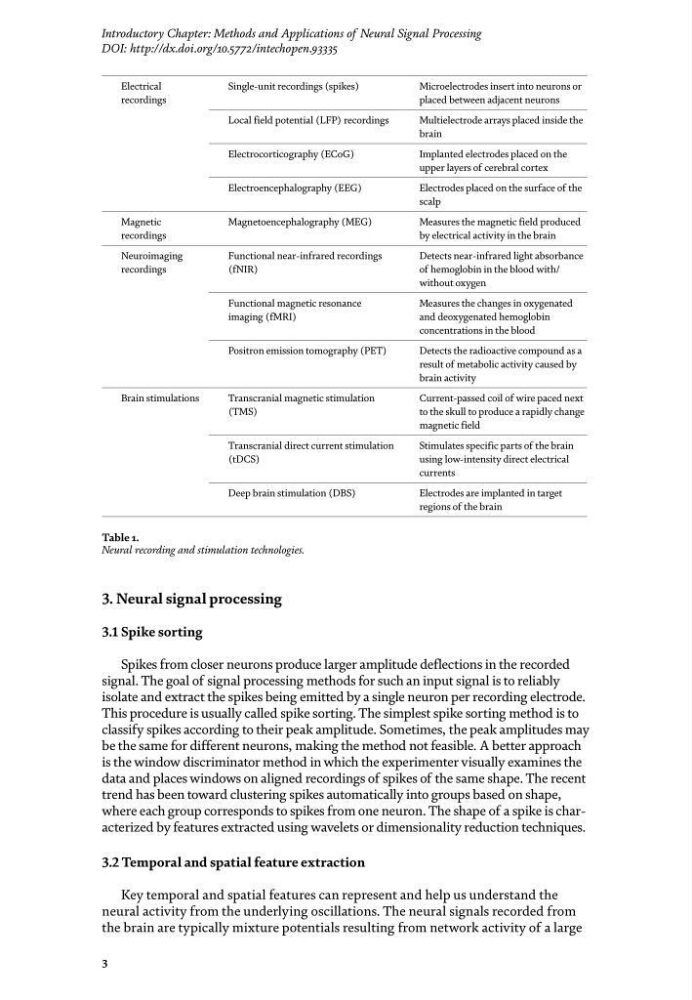
Table 1.
Neural recording and stimulation technologies.
Introductory Chapter: Methods and Applications of Neural Signal Processing
DOI: http://dx.doi.org/10.5772/intechopen.93335
3. Neural signal processing
3.1 Spike sorting
Spikes from closer neurons produce larger amplitude deflections in the recorded
signal. The goal of signal processing methods for such an input signal is to reliably
isolate and extract the spikes being emitted by a single neuron per recording electrode.
This procedure is usually called spike sorting. The simplest spike sorting method is to
classify spikes according to their peak amplitude. Sometimes, the peak amplitudes may
be the same for different neurons, making the method not feasible. A better approach
is the window discriminator method in which the experimenter visually examines the
data and places windows on aligned recordings of spikes of the same shape. The recent
trend has been toward clustering spikes automatically into groups based on shape,
where each group corresponds to spikes from one neuron. The shape of a spike is characterized by features extracted using wavelets or dimensionality reduction techniques.
3.2 Temporal and spatial feature extraction
Key temporal and spatial features can represent and help us understand the
neural activity from the underlying oscillations. The neural signals recorded from
the brain are typically mixture potentials resulting from network activity of a large
Electrical
recordings
Single-unit recordings (spikes)
Microelectrodes insert into neurons or
placed between adjacent neurons
Local field potential (LFP) recordings
Multielectrode arrays placed inside the
brain
Electrocorticography (ECoG)
Implanted electrodes placed on the
upper layers of cerebral cortex
Electroencephalography (EEG)
Electrodes placed on the surface of the
scalp
Magnetic
recordings
Magnetoencephalography (MEG)
Measures the magnetic field produced
by electrical activity in the brain
Neuroimaging
recordings
Functional near-infrared recordings
(fNIR)
Detects near-infrared light absorbance
of hemoglobin in the blood with/
without oxygen
Functional magnetic resonance
imaging (fMRI)
Measures the changes in oxygenated
and deoxygenated hemoglobin
concentrations in the blood
Positron emission tomography (PET)
Detects the radioactive compound as a
result of metabolic activity caused by
brain activity
Brain stimulations
Transcranial magnetic stimulation
(TMS)
Current-passed coil of wire paced next
to the skull to produce a rapidly change
magnetic field
Transcranial direct current stimulation
(tDCS)
Stimulates specific parts of the brain
using low-intensity direct electrical
currents
Deep brain stimulation (DBS)
Electrodes are implanted in target
regions of the brain
Table 1.
Neural recording and stimulation technologies.