

Due to enantiomer-specific differences in interaction between analyte and CSP,
the peak shapes of the target enantiomer may differ significantly (Fig. 7.3) and thus
hamper the determination of the enantiomeric signature. Therefore, similar peak
shapes are of advantage and the methods should be optimised accordingly.
High: 1 g ristocetin per 3 g silica; medium 0.75 g ristocetin per 3 g silica; low
0.5 g ristocetin per 3 g silica. Figure reproduced from Gubitz and Schmid (2004).
As demonstrated in Fig. 7.3, modification of the amount of chiral selector added
into the stationary phase may help to improve/modify the chromatographic performance for selected substances. Improved chromatographic performance can also be
achieved by adding chiral modifiers into the mobile phase or modify the operating
temperature for separation in a dedicated column oven.
Prolonged column storage may lead to deterioration of CSPs and lead to the loss
of enantiomer selectivity when reusing the column. The storage conditions for the
respective columns should, thus, be arranged in accordance with the information
given by the producing company.
In many cases, the enantiomer selectivity deteriorates with increasing back
pressure in the HPLC separation system. Thus, especially for CSPs containing
bioactive chiral separators, the mobile phase flow rate should be selected such that
the column backpressure is kept <300 bar.
Practical advice for optimisation and validation of enantiomer-selective HPLC
and UHPLC methods is given in several comprehensive monographs and reviews
(Krstulović 1989; Ahuja 1997, 2000; Ward 2000; Gubitz and Schmid 2004).
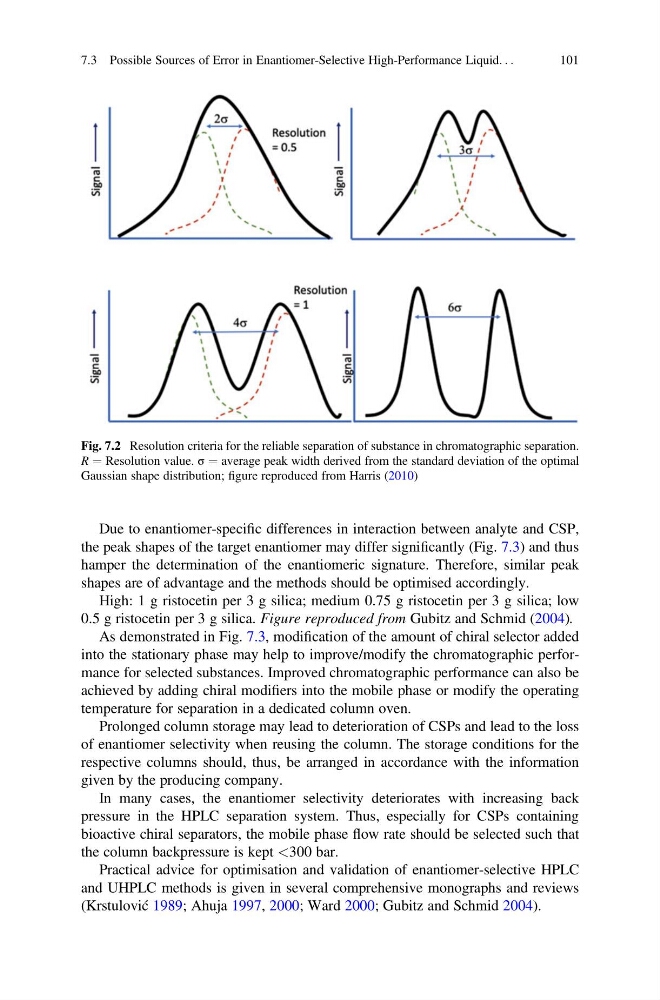
Fig. 7.2 Resolution criteria for the reliable separation of substance in chromatographic separation.
R ¼ Resolution value. σ ¼ average peak width derived from the standard deviation of the optimal
Gaussian shape distribution; figure reproduced from Harris (2010)
7.3 Possible Sources of Error in Enantiomer-Selective High-Performance Liquid. . .
101
the peak shapes of the target enantiomer may differ significantly (Fig. 7.3) and thus
hamper the determination of the enantiomeric signature. Therefore, similar peak
shapes are of advantage and the methods should be optimised accordingly.
High: 1 g ristocetin per 3 g silica; medium 0.75 g ristocetin per 3 g silica; low
0.5 g ristocetin per 3 g silica. Figure reproduced from Gubitz and Schmid (2004).
As demonstrated in Fig. 7.3, modification of the amount of chiral selector added
into the stationary phase may help to improve/modify the chromatographic performance for selected substances. Improved chromatographic performance can also be
achieved by adding chiral modifiers into the mobile phase or modify the operating
temperature for separation in a dedicated column oven.
Prolonged column storage may lead to deterioration of CSPs and lead to the loss
of enantiomer selectivity when reusing the column. The storage conditions for the
respective columns should, thus, be arranged in accordance with the information
given by the producing company.
In many cases, the enantiomer selectivity deteriorates with increasing back
pressure in the HPLC separation system. Thus, especially for CSPs containing
bioactive chiral separators, the mobile phase flow rate should be selected such that
the column backpressure is kept <300 bar.
Practical advice for optimisation and validation of enantiomer-selective HPLC
and UHPLC methods is given in several comprehensive monographs and reviews
(Krstulović 1989; Ahuja 1997, 2000; Ward 2000; Gubitz and Schmid 2004).
Fig. 7.2 Resolution criteria for the reliable separation of substance in chromatographic separation.
R ¼ Resolution value. σ ¼ average peak width derived from the standard deviation of the optimal
Gaussian shape distribution; figure reproduced from Harris (2010)
7.3 Possible Sources of Error in Enantiomer-Selective High-Performance Liquid. . .
101