

Reflections About the Food–Energy–Water Nexus in a World …
25
Table 12 Development of the investments in FEW sector and the other two sectors—in nominal
monetary units
Country (growth rate)/year
1
2
3
4
5
6
7
8
9
10 11 12
Food–energy–water—A (−0.0%) 34 35 34 34 34 34 34 34 34 34 34 34
Industry and service—A
110 111 110 110 110 110 110 110 110 110 109 109
Food–energy–water—B (1.2%)
68 69 69 70 69 72 73 74 74 75 76 77
Industry and service—B
221 224 226 229 224 234 238 241 244 246 249 252
Food–energy–water—C (1.9%)
69 70 72 74 71 76 77 79 80 82 83 85
Industry and service—C
221 226 231 236 226 244 248 252 257 262 267 271
Food–energy–water—D (−1.3%) 69 69 69 69 69 69 69 69 69 69 68 68
Industry and service—D
111 109 108 106 105 104 102 101 100 99 96 96
Source Own calculations (2020) and IEK-STE/SRH (2020)
12-year period, whereas the country D faces a significant decline in its savings,
whereas it remains unchanged for country A.
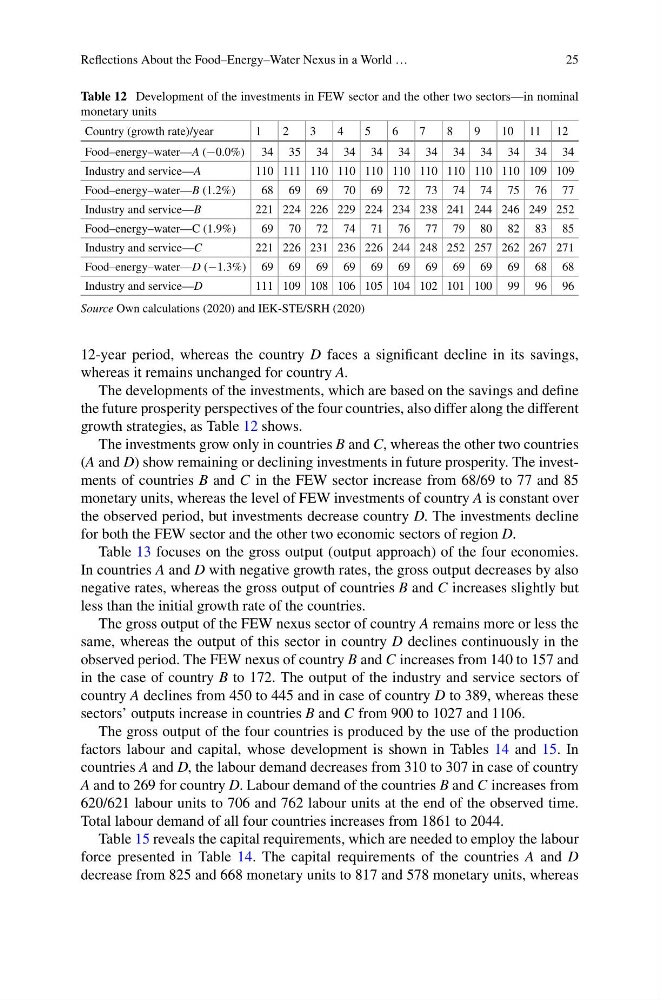
The developments of the investments, which are based on the savings and define
the future prosperity perspectives of the four countries, also differ along the different
growth strategies, as Table 12 shows.
The investments grow only in countries B and C, whereas the other two countries
(A and D) show remaining or declining investments in future prosperity. The investments of countries B and C in the FEW sector increase from 68/69 to 77 and 85
monetary units, whereas the level of FEW investments of country A is constant over
the observed period, but investments decrease country D. The investments decline
for both the FEW sector and the other two economic sectors of region D.
Table 13 focuses on the gross output (output approach) of the four economies.
In countries A and D with negative growth rates, the gross output decreases by also
negative rates, whereas the gross output of countries B and C increases slightly but
less than the initial growth rate of the countries.
The gross output of the FEW nexus sector of country A remains more or less the
same, whereas the output of this sector in country D declines continuously in the
observed period. The FEW nexus of country B and C increases from 140 to 157 and
in the case of country B to 172. The output of the industry and service sectors of
country A declines from 450 to 445 and in case of country D to 389, whereas these
sectors’ outputs increase in countries B and C from 900 to 1027 and 1106.
The gross output of the four countries is produced by the use of the production
factors labour and capital, whose development is shown in Tables 14 and 15. In
countries A and D, the labour demand decreases from 310 to 307 in case of country
A and to 269 for country D. Labour demand of the countries B and C increases from
620/621 labour units to 706 and 762 labour units at the end of the observed time.
Total labour demand of all four countries increases from 1861 to 2044.
Table 15 reveals the capital requirements, which are needed to employ the labour
force presented in Table 14. The capital requirements of the countries A and D
decrease from 825 and 668 monetary units to 817 and 578 monetary units, whereas
25
Table 12 Development of the investments in FEW sector and the other two sectors—in nominal
monetary units
Country (growth rate)/year
1
2
3
4
5
6
7
8
9
10 11 12
Food–energy–water—A (−0.0%) 34 35 34 34 34 34 34 34 34 34 34 34
Industry and service—A
110 111 110 110 110 110 110 110 110 110 109 109
Food–energy–water—B (1.2%)
68 69 69 70 69 72 73 74 74 75 76 77
Industry and service—B
221 224 226 229 224 234 238 241 244 246 249 252
Food–energy–water—C (1.9%)
69 70 72 74 71 76 77 79 80 82 83 85
Industry and service—C
221 226 231 236 226 244 248 252 257 262 267 271
Food–energy–water—D (−1.3%) 69 69 69 69 69 69 69 69 69 69 68 68
Industry and service—D
111 109 108 106 105 104 102 101 100 99 96 96
Source Own calculations (2020) and IEK-STE/SRH (2020)
12-year period, whereas the country D faces a significant decline in its savings,
whereas it remains unchanged for country A.
The developments of the investments, which are based on the savings and define
the future prosperity perspectives of the four countries, also differ along the different
growth strategies, as Table 12 shows.
The investments grow only in countries B and C, whereas the other two countries
(A and D) show remaining or declining investments in future prosperity. The investments of countries B and C in the FEW sector increase from 68/69 to 77 and 85
monetary units, whereas the level of FEW investments of country A is constant over
the observed period, but investments decrease country D. The investments decline
for both the FEW sector and the other two economic sectors of region D.
Table 13 focuses on the gross output (output approach) of the four economies.
In countries A and D with negative growth rates, the gross output decreases by also
negative rates, whereas the gross output of countries B and C increases slightly but
less than the initial growth rate of the countries.
The gross output of the FEW nexus sector of country A remains more or less the
same, whereas the output of this sector in country D declines continuously in the
observed period. The FEW nexus of country B and C increases from 140 to 157 and
in the case of country B to 172. The output of the industry and service sectors of
country A declines from 450 to 445 and in case of country D to 389, whereas these
sectors’ outputs increase in countries B and C from 900 to 1027 and 1106.
The gross output of the four countries is produced by the use of the production
factors labour and capital, whose development is shown in Tables 14 and 15. In
countries A and D, the labour demand decreases from 310 to 307 in case of country
A and to 269 for country D. Labour demand of the countries B and C increases from
620/621 labour units to 706 and 762 labour units at the end of the observed time.
Total labour demand of all four countries increases from 1861 to 2044.
Table 15 reveals the capital requirements, which are needed to employ the labour
force presented in Table 14. The capital requirements of the countries A and D
decrease from 825 and 668 monetary units to 817 and 578 monetary units, whereas