

The German Capability Index—An Operationalization of Sen’s …
183
The analysis so far has revealed heterogeneity in the capability budget across the
household groups and their respective justice spreads. Hence, the different effects
will now be summarized in the capability index for the various German household
groups based on the equations of Sect. 4.2.
4.4 Revealed Capabilities
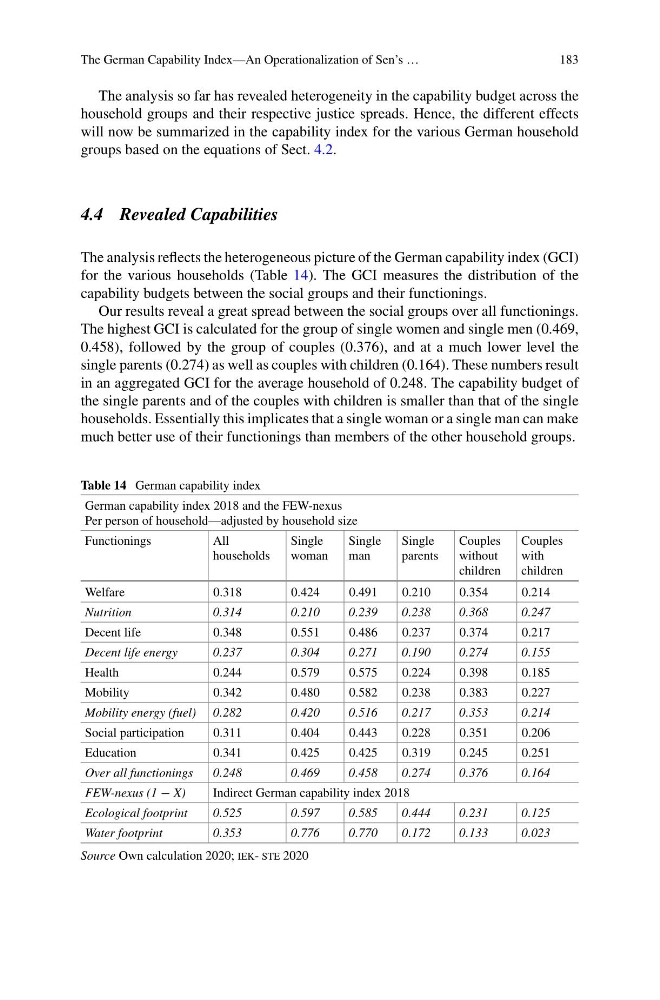
The analysis reflects the heterogeneous picture of the German capability index (GCI)
for the various households (Table 14). The GCI measures the distribution of the
capability budgets between the social groups and their functionings.
Our results reveal a great spread between the social groups over all functionings.
The highest GCI is calculated for the group of single women and single men (0.469,
0.458), followed by the group of couples (0.376), and at a much lower level the
single parents (0.274) as well as couples with children (0.164). These numbers result
in an aggregated GCI for the average household of 0.248. The capability budget of
the single parents and of the couples with children is smaller than that of the single
households. Essentially this implicates that a single woman or a single man can make
much better use of their functionings than members of the other household groups.
Table 14 German capability index
German capability index 2018 and the FEW-nexus
Per person of household—adjusted by household size
Functionings
All
households
Single
woman
Single
man
Single
parents
Couples
without
children
Couples
with
children
Welfare
0.318
0.424
0.491
0.210
0.354
0.214
Nutrition
0.314
0.210
0.239
0.238
0.368
0.247
Decent life
0.348
0.551
0.486
0.237
0.374
0.217
Decent life energy
0.237
0.304
0.271
0.190
0.274
0.155
Health
0.244
0.579
0.575
0.224
0.398
0.185
Mobility
0.342
0.480
0.582
0.238
0.383
0.227
Mobility energy (fuel) 0.282
0.420
0.516
0.217
0.353
0.214
Social participation
0.311
0.404
0.443
0.228
0.351
0.206
Education
0.341
0.425
0.425
0.319
0.245
0.251
Over all functionings
0.248
0.469
0.458
0.274
0.376
0.164
FEW-nexus (1 − X)
Indirect German capability index 2018
Ecological footprint
0.525
0.597
0.585
0.444
0.231
0.125
Water footprint
0.353
0.776
0.770
0.172
0.133
0.023
Source Own calculation 2020; iek- ste 2020
183
The analysis so far has revealed heterogeneity in the capability budget across the
household groups and their respective justice spreads. Hence, the different effects
will now be summarized in the capability index for the various German household
groups based on the equations of Sect. 4.2.
4.4 Revealed Capabilities
The analysis reflects the heterogeneous picture of the German capability index (GCI)
for the various households (Table 14). The GCI measures the distribution of the
capability budgets between the social groups and their functionings.
Our results reveal a great spread between the social groups over all functionings.
The highest GCI is calculated for the group of single women and single men (0.469,
0.458), followed by the group of couples (0.376), and at a much lower level the
single parents (0.274) as well as couples with children (0.164). These numbers result
in an aggregated GCI for the average household of 0.248. The capability budget of
the single parents and of the couples with children is smaller than that of the single
households. Essentially this implicates that a single woman or a single man can make
much better use of their functionings than members of the other household groups.
Table 14 German capability index
German capability index 2018 and the FEW-nexus
Per person of household—adjusted by household size
Functionings
All
households
Single
woman
Single
man
Single
parents
Couples
without
children
Couples
with
children
Welfare
0.318
0.424
0.491
0.210
0.354
0.214
Nutrition
0.314
0.210
0.239
0.238
0.368
0.247
Decent life
0.348
0.551
0.486
0.237
0.374
0.217
Decent life energy
0.237
0.304
0.271
0.190
0.274
0.155
Health
0.244
0.579
0.575
0.224
0.398
0.185
Mobility
0.342
0.480
0.582
0.238
0.383
0.227
Mobility energy (fuel) 0.282
0.420
0.516
0.217
0.353
0.214
Social participation
0.311
0.404
0.443
0.228
0.351
0.206
Education
0.341
0.425
0.425
0.319
0.245
0.251
Over all functionings
0.248
0.469
0.458
0.274
0.376
0.164
FEW-nexus (1 − X)
Indirect German capability index 2018
Ecological footprint
0.525
0.597
0.585
0.444
0.231
0.125
Water footprint
0.353
0.776
0.770
0.172
0.133
0.023
Source Own calculation 2020; iek- ste 2020