

10
H. Schlör et al.
The Bureau explained “the decline in second quarter GDP reflected the response
to COVID-19, as “stay-at-home” orders issued in March and April were partially
lifted in some areas of the country in May and June, and government pandemic
assistance payments were distributed to households and businesses [78].” The BEA
added that the bureau currently does not fully reveal the total economic effects of the
COVID-19 pandemic on the US economy [78].
The decline of the real GDP reflects the break-in of the personal consumption
expenditures of the US consumers by about −34.6% in the second quarter of 2020,
whereas the gross private domestic investments crashed by −49%. This collapse
also has an effect on the exports and imports of the US economy. The US imports
are breaking down by −56.7%, the exports even by −64.1%. This decline of the
US economy is part of the larger, worldwide economic decline [55]. This global
development also has an effect on the development of the global CO 2 -emissions.
The severe governmental reactions of countries around the world in response to
the COVID-19 pandemic and the essential global shutdown have led to a dramatic
reduction in energy demand around the world [42], especially caused by the industrial
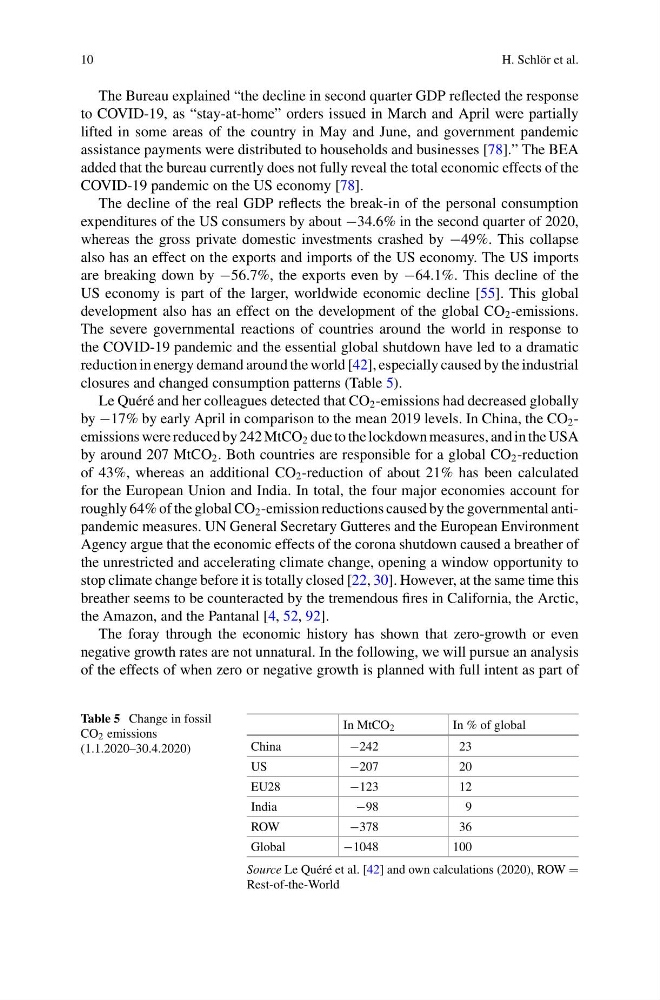
closures and changed consumption patterns (Table 5).
Le Quéré and her colleagues detected that CO 2 -emissions had decreased globally
by −17% by early April in comparison to the mean 2019 levels. In China, the CO 2 -
emissions were reduced by 242 MtCO 2 due to the lockdown measures, and in the USA
by around 207 MtCO 2 . Both countries are responsible for a global CO 2 -reduction
of 43%, whereas an additional CO 2 -reduction of about 21% has been calculated
for the European Union and India. In total, the four major economies account for
roughly 64% of the global CO 2 -emission reductions caused by the governmental antipandemic measures. UN General Secretary Gutteres and the European Environment
Agency argue that the economic effects of the corona shutdown caused a breather of
the unrestricted and accelerating climate change, opening a window opportunity to
stop climate change before it is totally closed [22, 30]. However, at the same time this
breather seems to be counteracted by the tremendous fires in California, the Arctic,
the Amazon, and the Pantanal [4, 52, 92].
The foray through the economic history has shown that zero-growth or even
negative growth rates are not unnatural. In the following, we will pursue an analysis
of the effects of when zero or negative growth is planned with full intent as part of
Table 5 Change in fossil
CO 2 emissions
(1.1.2020–30.4.2020)
In MtCO 2
In % of global
China
−242
23
US
−207
20
EU28
−123
12
India
−98
9
ROW
−378
36
Global
−1048
100
Source Le Quéré et al. [42] and own calculations (2020), ROW =
Rest-of-the-World
H. Schlör et al.
The Bureau explained “the decline in second quarter GDP reflected the response
to COVID-19, as “stay-at-home” orders issued in March and April were partially
lifted in some areas of the country in May and June, and government pandemic
assistance payments were distributed to households and businesses [78].” The BEA
added that the bureau currently does not fully reveal the total economic effects of the
COVID-19 pandemic on the US economy [78].
The decline of the real GDP reflects the break-in of the personal consumption
expenditures of the US consumers by about −34.6% in the second quarter of 2020,
whereas the gross private domestic investments crashed by −49%. This collapse
also has an effect on the exports and imports of the US economy. The US imports
are breaking down by −56.7%, the exports even by −64.1%. This decline of the
US economy is part of the larger, worldwide economic decline [55]. This global
development also has an effect on the development of the global CO 2 -emissions.
The severe governmental reactions of countries around the world in response to
the COVID-19 pandemic and the essential global shutdown have led to a dramatic
reduction in energy demand around the world [42], especially caused by the industrial
closures and changed consumption patterns (Table 5).
Le Quéré and her colleagues detected that CO 2 -emissions had decreased globally
by −17% by early April in comparison to the mean 2019 levels. In China, the CO 2 -
emissions were reduced by 242 MtCO 2 due to the lockdown measures, and in the USA
by around 207 MtCO 2 . Both countries are responsible for a global CO 2 -reduction
of 43%, whereas an additional CO 2 -reduction of about 21% has been calculated
for the European Union and India. In total, the four major economies account for
roughly 64% of the global CO 2 -emission reductions caused by the governmental antipandemic measures. UN General Secretary Gutteres and the European Environment
Agency argue that the economic effects of the corona shutdown caused a breather of
the unrestricted and accelerating climate change, opening a window opportunity to
stop climate change before it is totally closed [22, 30]. However, at the same time this
breather seems to be counteracted by the tremendous fires in California, the Arctic,
the Amazon, and the Pantanal [4, 52, 92].
The foray through the economic history has shown that zero-growth or even
negative growth rates are not unnatural. In the following, we will pursue an analysis
of the effects of when zero or negative growth is planned with full intent as part of
Table 5 Change in fossil
CO 2 emissions
(1.1.2020–30.4.2020)
In MtCO 2
In % of global
China
−242
23
US
−207
20
EU28
−123
12
India
−98
9
ROW
−378
36
Global
−1048
100
Source Le Quéré et al. [42] and own calculations (2020), ROW =
Rest-of-the-World