

50
Relative Sea-Level Change in North Carolina During the Past
~2000 Years
We spent about 5 years reconstructing relative sea-level changes in North Carolina
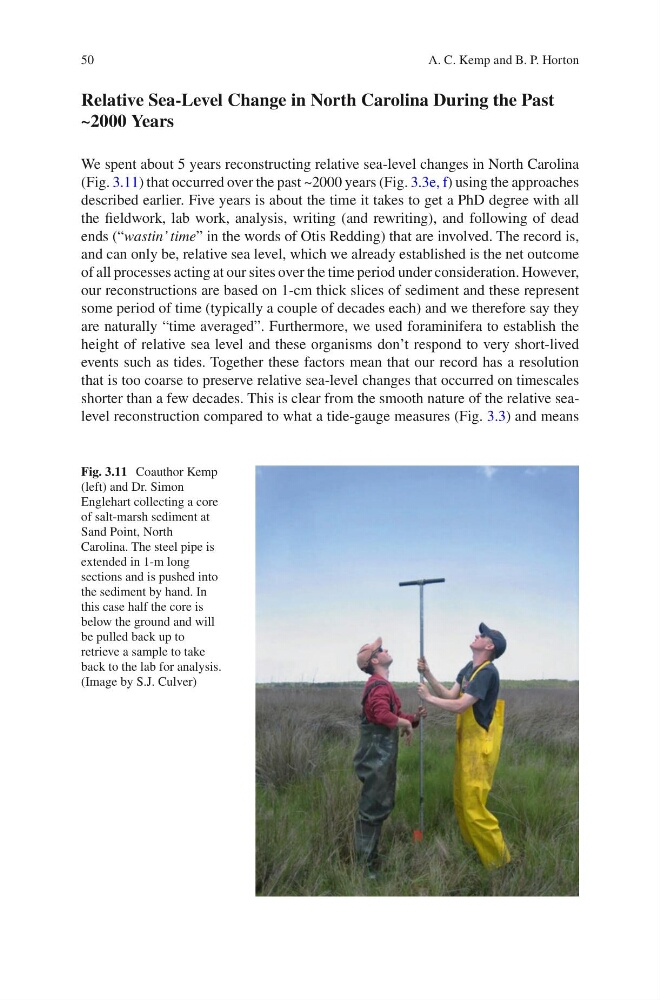
(Fig. 3.11) that occurred over the past ~2000 years (Fig. 3.3e, f) using the approaches
described earlier. Five years is about the time it takes to get a PhD degree with all
the fieldwork, lab work, analysis, writing (and rewriting), and following of dead
ends (“wastin’ time” in the words of Otis Redding) that are involved. The record is,
and can only be, relative sea level, which we already established is the net outcome
of all processes acting at our sites over the time period under consideration. However,
our reconstructions are based on 1-cm thick slices of sediment and these represent
some period of time (typically a couple of decades each) and we therefore say they
are naturally “time averaged”. Furthermore, we used foraminifera to establish the
height of relative sea level and these organisms don’t respond to very short-lived
events such as tides. Together these factors mean that our record has a resolution
that is too coarse to preserve relative sea-level changes that occurred on timescales
shorter than a few decades. This is clear from the smooth nature of the relative sealevel reconstruction compared to what a tide-gauge measures (Fig. 3.3) and means
Fig. 3.11 Coauthor Kemp
(left) and Dr. Simon
Englehart collecting a core
of salt-marsh sediment at
Sand Point, North
Carolina. The steel pipe is
extended in 1-m long
sections and is pushed into
the sediment by hand. In
this case half the core is
below the ground and will
be pulled back up to
retrieve a sample to take
back to the lab for analysis.
(Image by S.J. Culver)
A. C. Kemp and B. P. Horton
Relative Sea-Level Change in North Carolina During the Past
~2000 Years
We spent about 5 years reconstructing relative sea-level changes in North Carolina
(Fig. 3.11) that occurred over the past ~2000 years (Fig. 3.3e, f) using the approaches
described earlier. Five years is about the time it takes to get a PhD degree with all
the fieldwork, lab work, analysis, writing (and rewriting), and following of dead
ends (“wastin’ time” in the words of Otis Redding) that are involved. The record is,
and can only be, relative sea level, which we already established is the net outcome
of all processes acting at our sites over the time period under consideration. However,
our reconstructions are based on 1-cm thick slices of sediment and these represent
some period of time (typically a couple of decades each) and we therefore say they
are naturally “time averaged”. Furthermore, we used foraminifera to establish the
height of relative sea level and these organisms don’t respond to very short-lived
events such as tides. Together these factors mean that our record has a resolution
that is too coarse to preserve relative sea-level changes that occurred on timescales
shorter than a few decades. This is clear from the smooth nature of the relative sealevel reconstruction compared to what a tide-gauge measures (Fig. 3.3) and means
Fig. 3.11 Coauthor Kemp
(left) and Dr. Simon
Englehart collecting a core
of salt-marsh sediment at
Sand Point, North
Carolina. The steel pipe is
extended in 1-m long
sections and is pushed into
the sediment by hand. In
this case half the core is
below the ground and will
be pulled back up to
retrieve a sample to take
back to the lab for analysis.
(Image by S.J. Culver)
A. C. Kemp and B. P. Horton