

202
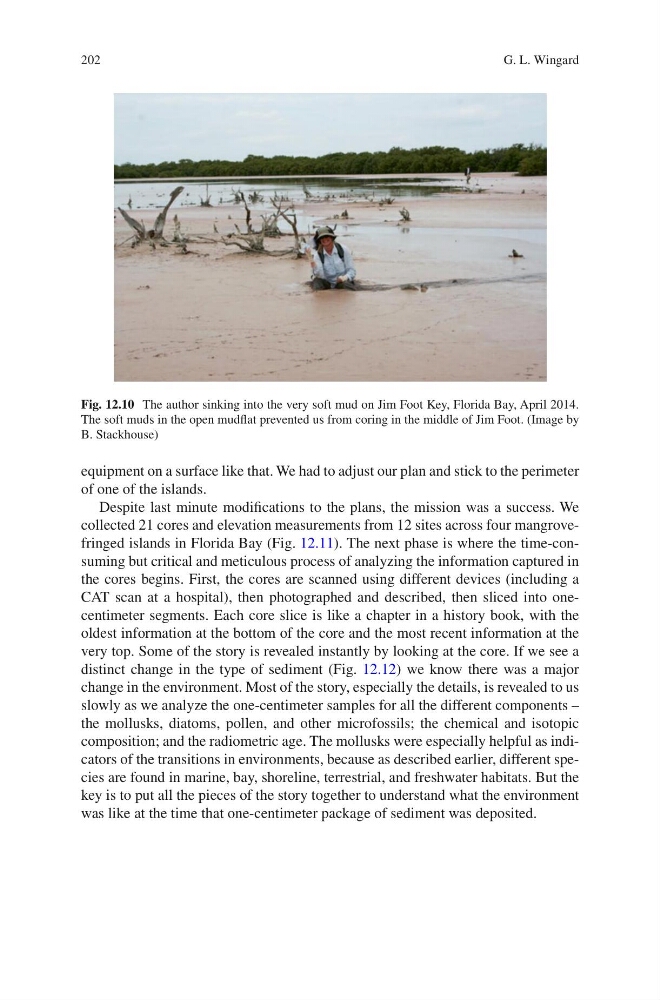
equipment on a surface like that. We had to adjust our plan and stick to the perimeter
of one of the islands.
Despite last minute modifications to the plans, the mission was a success. We
collected 21 cores and elevation measurements from 12 sites across four mangrovefringed islands in Florida Bay (Fig. 12.11). The next phase is where the time-consuming but critical and meticulous process of analyzing the information captured in
the cores begins. First, the cores are scanned using different devices (including a
CAT scan at a hospital), then photographed and described, then sliced into onecentimeter segments. Each core slice is like a chapter in a history book, with the
oldest information at the bottom of the core and the most recent information at the
very top. Some of the story is revealed instantly by looking at the core. If we see a
distinct change in the type of sediment (Fig. 12.12) we know there was a major
change in the environment. Most of the story, especially the details, is revealed to us
slowly as we analyze the one-centimeter samples for all the different components –
the mollusks, diatoms, pollen, and other microfossils; the chemical and isotopic
composition; and the radiometric age. The mollusks were especially helpful as indicators of the transitions in environments, because as described earlier, different species are found in marine, bay, shoreline, terrestrial, and freshwater habitats. But the
key is to put all the pieces of the story together to understand what the environment
was like at the time that one-centimeter package of sediment was deposited.
Fig. 12.10 The author sinking into the very soft mud on Jim Foot Key, Florida Bay, April 2014.
The soft muds in the open mudflat prevented us from coring in the middle of Jim Foot. (Image by
B. Stackhouse)
G. L. Wingard
equipment on a surface like that. We had to adjust our plan and stick to the perimeter
of one of the islands.
Despite last minute modifications to the plans, the mission was a success. We
collected 21 cores and elevation measurements from 12 sites across four mangrovefringed islands in Florida Bay (Fig. 12.11). The next phase is where the time-consuming but critical and meticulous process of analyzing the information captured in
the cores begins. First, the cores are scanned using different devices (including a
CAT scan at a hospital), then photographed and described, then sliced into onecentimeter segments. Each core slice is like a chapter in a history book, with the
oldest information at the bottom of the core and the most recent information at the
very top. Some of the story is revealed instantly by looking at the core. If we see a
distinct change in the type of sediment (Fig. 12.12) we know there was a major
change in the environment. Most of the story, especially the details, is revealed to us
slowly as we analyze the one-centimeter samples for all the different components –
the mollusks, diatoms, pollen, and other microfossils; the chemical and isotopic
composition; and the radiometric age. The mollusks were especially helpful as indicators of the transitions in environments, because as described earlier, different species are found in marine, bay, shoreline, terrestrial, and freshwater habitats. But the
key is to put all the pieces of the story together to understand what the environment
was like at the time that one-centimeter package of sediment was deposited.
Fig. 12.10 The author sinking into the very soft mud on Jim Foot Key, Florida Bay, April 2014.
The soft muds in the open mudflat prevented us from coring in the middle of Jim Foot. (Image by
B. Stackhouse)
G. L. Wingard