

200
and the freshwater influence did not reach the Gulf. Also, the mollusk populations
began to shift to species that could tolerate very wide ranges of salinity. These
changes were seen most significantly along the mangrove shoreline where average
salinity almost doubled (increased by 44%) between the late 1800s and the beginning of the twenty-first century. Our research team found that freshwater flow
through the Everglades into the mangrove transition zone along the southern edge
of mainland Florida would have been three to four times greater and flow into the
southwest coastal mangrove forests would have been two times greater in the late
1800s compared to the end of the twentieth century. These estimations of past flow
and salinity have been used directly by resource managers to set restoration goals.
Shifting Gears to Investigate Coastline Changes
During this period when our research was focused on understanding past salinity
and freshwater flow, climate change and sea-level rise were increasingly becoming
part of the public conversation, and I wondered how these changes would affect
south Florida and what information we could contribute to the discussion. We know
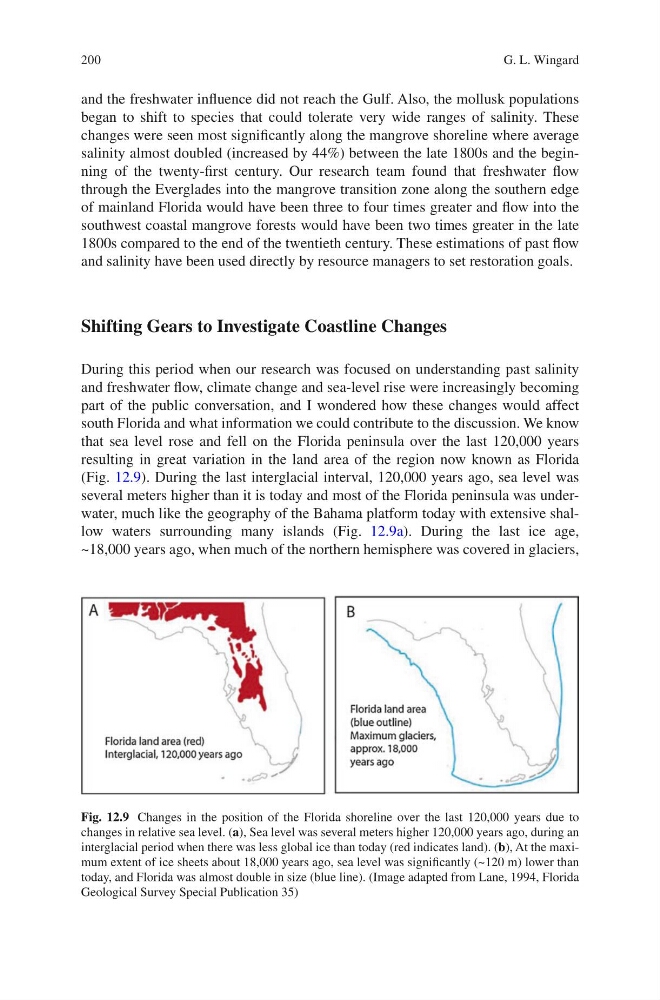
that sea level rose and fell on the Florida peninsula over the last 120,000 years
resulting in great variation in the land area of the region now known as Florida
(Fig. 12.9). During the last interglacial interval, 120,000 years ago, sea level was
several meters higher than it is today and most of the Florida peninsula was underwater, much like the geography of the Bahama platform today with extensive shallow waters surrounding many islands (Fig. 12.9a). During the last ice age,
~18,000 years ago, when much of the northern hemisphere was covered in glaciers,
Fig. 12.9 Changes in the position of the Florida shoreline over the last 120,000 years due to
changes in relative sea level. (a), Sea level was several meters higher 120,000 years ago, during an
interglacial period when there was less global ice than today (red indicates land). (b), At the maximum extent of ice sheets about 18,000 years ago, sea level was significantly (~120 m) lower than
today, and Florida was almost double in size (blue line). (Image adapted from Lane, 1994, Florida
Geological Survey Special Publication 35)
G. L. Wingard
and the freshwater influence did not reach the Gulf. Also, the mollusk populations
began to shift to species that could tolerate very wide ranges of salinity. These
changes were seen most significantly along the mangrove shoreline where average
salinity almost doubled (increased by 44%) between the late 1800s and the beginning of the twenty-first century. Our research team found that freshwater flow
through the Everglades into the mangrove transition zone along the southern edge
of mainland Florida would have been three to four times greater and flow into the
southwest coastal mangrove forests would have been two times greater in the late
1800s compared to the end of the twentieth century. These estimations of past flow
and salinity have been used directly by resource managers to set restoration goals.
Shifting Gears to Investigate Coastline Changes
During this period when our research was focused on understanding past salinity
and freshwater flow, climate change and sea-level rise were increasingly becoming
part of the public conversation, and I wondered how these changes would affect
south Florida and what information we could contribute to the discussion. We know
that sea level rose and fell on the Florida peninsula over the last 120,000 years
resulting in great variation in the land area of the region now known as Florida
(Fig. 12.9). During the last interglacial interval, 120,000 years ago, sea level was
several meters higher than it is today and most of the Florida peninsula was underwater, much like the geography of the Bahama platform today with extensive shallow waters surrounding many islands (Fig. 12.9a). During the last ice age,
~18,000 years ago, when much of the northern hemisphere was covered in glaciers,
Fig. 12.9 Changes in the position of the Florida shoreline over the last 120,000 years due to
changes in relative sea level. (a), Sea level was several meters higher 120,000 years ago, during an
interglacial period when there was less global ice than today (red indicates land). (b), At the maximum extent of ice sheets about 18,000 years ago, sea level was significantly (~120 m) lower than
today, and Florida was almost double in size (blue line). (Image adapted from Lane, 1994, Florida
Geological Survey Special Publication 35)
G. L. Wingard