

178
Each class would first have to develop a detailed, descriptive classification scheme
based upon morphology, sediment composition, and biological components. This
involved days of crisscrossing the flats on foot and in dilapidated beach-buggies,
many long skating sessions on the algal mats, and endless hours of laboratory analysis. Finally, the classification scheme had a semblance of order, with appropriate
definitions, and we could start to survey in the location and distribution of each
component of the many different sedimentary environments. This resulted in the
students gradually seeing the big picture as each new puzzle-piece was added. The
final objective then was for each class to evaluate and interpret the often dramatic
set of changes that had taken place since the beginning of the soggy groggy and to
compare their results and conclusions with those of previous classes.
The Storm Soggy Groggy
The “storm soggy groggy” came later in the semester when major weather systems
would begin to beat the coast with driving wind and waves (Fig. 11.6). This event
often became the culmination of our semester of coastal immersion. Since the storm
cycle represents a set of processes operating at a much larger scale than the tidal
cycle, we had to establish a diverse set of monitoring stations throughout the coastal
system designed with a retreat plan in place in case the storm became too strong for
us to deal with. During big storms, we would monitor Oregon Inlet as long as the
storm tides would allow and then we would check each station on the beach and
estuary as we retreated to stations on Roanoke Island. During smaller storms we
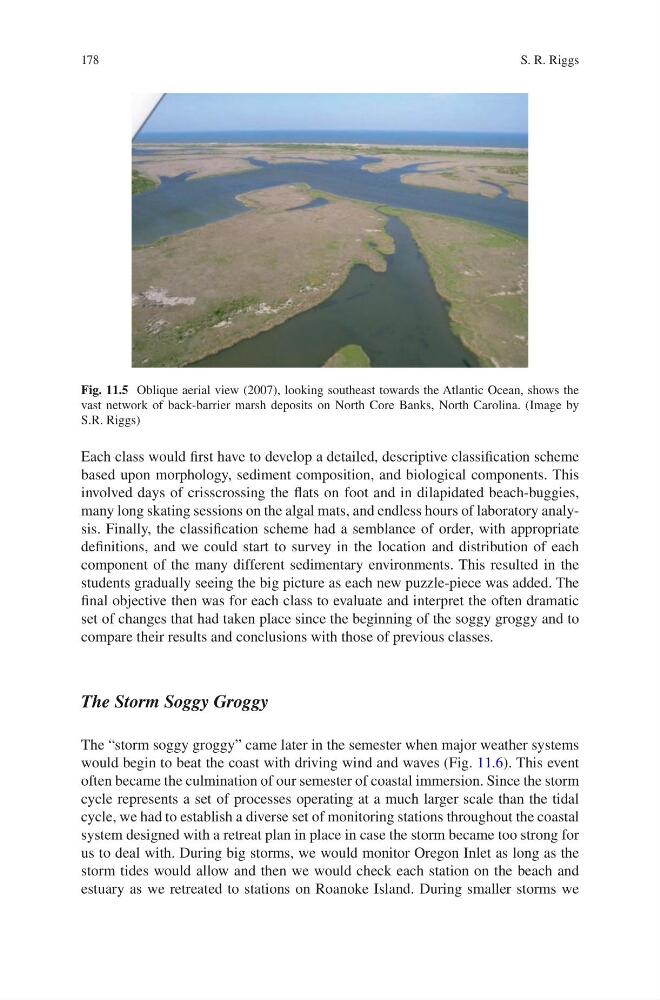
Fig. 11.5 Oblique aerial view (2007), looking southeast towards the Atlantic Ocean, shows the
vast network of back-barrier marsh deposits on North Core Banks, North Carolina. (Image by
S.R. Riggs)
S. R. Riggs
Each class would first have to develop a detailed, descriptive classification scheme
based upon morphology, sediment composition, and biological components. This
involved days of crisscrossing the flats on foot and in dilapidated beach-buggies,
many long skating sessions on the algal mats, and endless hours of laboratory analysis. Finally, the classification scheme had a semblance of order, with appropriate
definitions, and we could start to survey in the location and distribution of each
component of the many different sedimentary environments. This resulted in the
students gradually seeing the big picture as each new puzzle-piece was added. The
final objective then was for each class to evaluate and interpret the often dramatic
set of changes that had taken place since the beginning of the soggy groggy and to
compare their results and conclusions with those of previous classes.
The Storm Soggy Groggy
The “storm soggy groggy” came later in the semester when major weather systems
would begin to beat the coast with driving wind and waves (Fig. 11.6). This event
often became the culmination of our semester of coastal immersion. Since the storm
cycle represents a set of processes operating at a much larger scale than the tidal
cycle, we had to establish a diverse set of monitoring stations throughout the coastal
system designed with a retreat plan in place in case the storm became too strong for
us to deal with. During big storms, we would monitor Oregon Inlet as long as the
storm tides would allow and then we would check each station on the beach and
estuary as we retreated to stations on Roanoke Island. During smaller storms we
Fig. 11.5 Oblique aerial view (2007), looking southeast towards the Atlantic Ocean, shows the
vast network of back-barrier marsh deposits on North Core Banks, North Carolina. (Image by
S.R. Riggs)
S. R. Riggs