

165
to my left, and it took steps to its left, and over several minutes, we moved farther
and farther apart until we were both secure with our distance, direction, and intent.
Phew! I completed laying out the transect and then retraced my steps to get back in
touch with the fieldwork team and tell the tale of my near-death experience with
the dragon.
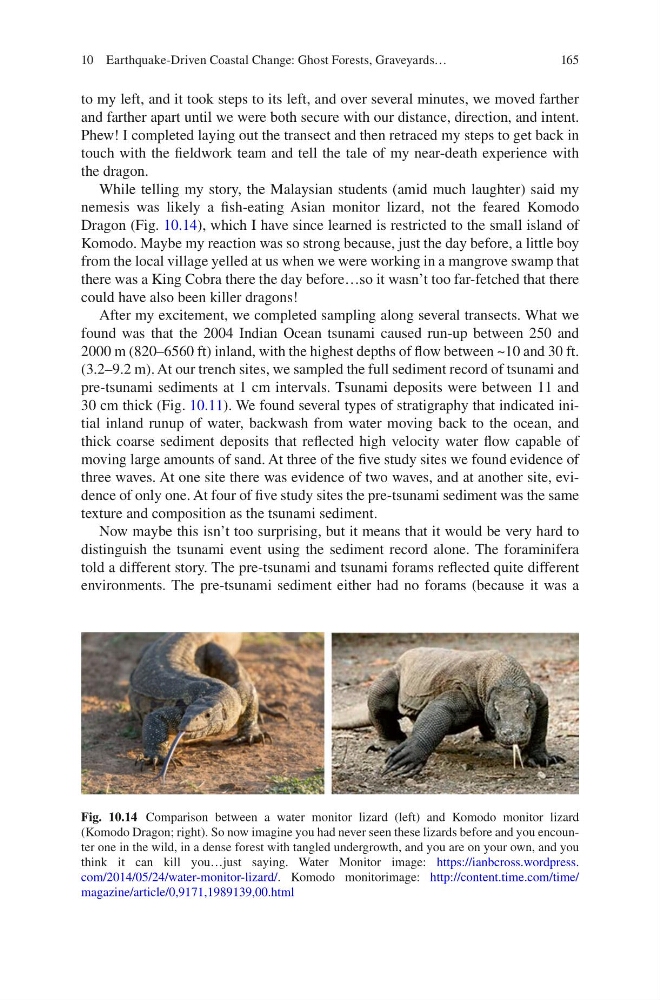
While telling my story, the Malaysian students (amid much laughter) said my
nemesis was likely a fish-eating Asian monitor lizard, not the feared Komodo
Dragon (Fig. 10.14), which I have since learned is restricted to the small island of
Komodo. Maybe my reaction was so strong because, just the day before, a little boy
from the local village yelled at us when we were working in a mangrove swamp that
there was a King Cobra there the day before…so it wasn’t too far-fetched that there
could have also been killer dragons!
After my excitement, we completed sampling along several transects. What we
found was that the 2004 Indian Ocean tsunami caused run-up between 250 and
2000 m (820–6560 ft) inland, with the highest depths of flow between ~10 and 30 ft.
(3.2–9.2 m). At our trench sites, we sampled the full sediment record of tsunami and
pre-tsunami sediments at 1 cm intervals. Tsunami deposits were between 11 and
30 cm thick (Fig. 10.11). We found several types of stratigraphy that indicated initial inland runup of water, backwash from water moving back to the ocean, and
thick coarse sediment deposits that reflected high velocity water flow capable of
moving large amounts of sand. At three of the five study sites we found evidence of
three waves. At one site there was evidence of two waves, and at another site, evidence of only one. At four of five study sites the pre-tsunami sediment was the same
texture and composition as the tsunami sediment.
Now maybe this isn’t too surprising, but it means that it would be very hard to
distinguish the tsunami event using the sediment record alone. The foraminifera
told a different story. The pre-tsunami and tsunami forams reflected quite different
environments. The pre-tsunami sediment either had no forams (because it was a
Fig. 10.14 Comparison between a water monitor lizard (left) and Komodo monitor lizard
(Komodo Dragon; right). So now imagine you had never seen these lizards before and you encounter one in the wild, in a dense forest with tangled undergrowth, and you are on your own, and you
think it can kill you…just saying. Water Monitor image: https://ianbcross.wordpress.
com/2014/05/24/water-monitor-lizard/. Komodo monitorimage: http://content.time.com/time/
magazine/article/0,9171,1989139,00.html
10 Earthquake-Driven Coastal Change: Ghost Forests, Graveyards…
to my left, and it took steps to its left, and over several minutes, we moved farther
and farther apart until we were both secure with our distance, direction, and intent.
Phew! I completed laying out the transect and then retraced my steps to get back in
touch with the fieldwork team and tell the tale of my near-death experience with
the dragon.
While telling my story, the Malaysian students (amid much laughter) said my
nemesis was likely a fish-eating Asian monitor lizard, not the feared Komodo
Dragon (Fig. 10.14), which I have since learned is restricted to the small island of
Komodo. Maybe my reaction was so strong because, just the day before, a little boy
from the local village yelled at us when we were working in a mangrove swamp that
there was a King Cobra there the day before…so it wasn’t too far-fetched that there
could have also been killer dragons!
After my excitement, we completed sampling along several transects. What we
found was that the 2004 Indian Ocean tsunami caused run-up between 250 and
2000 m (820–6560 ft) inland, with the highest depths of flow between ~10 and 30 ft.
(3.2–9.2 m). At our trench sites, we sampled the full sediment record of tsunami and
pre-tsunami sediments at 1 cm intervals. Tsunami deposits were between 11 and
30 cm thick (Fig. 10.11). We found several types of stratigraphy that indicated initial inland runup of water, backwash from water moving back to the ocean, and
thick coarse sediment deposits that reflected high velocity water flow capable of
moving large amounts of sand. At three of the five study sites we found evidence of
three waves. At one site there was evidence of two waves, and at another site, evidence of only one. At four of five study sites the pre-tsunami sediment was the same
texture and composition as the tsunami sediment.
Now maybe this isn’t too surprising, but it means that it would be very hard to
distinguish the tsunami event using the sediment record alone. The foraminifera
told a different story. The pre-tsunami and tsunami forams reflected quite different
environments. The pre-tsunami sediment either had no forams (because it was a
Fig. 10.14 Comparison between a water monitor lizard (left) and Komodo monitor lizard
(Komodo Dragon; right). So now imagine you had never seen these lizards before and you encounter one in the wild, in a dense forest with tangled undergrowth, and you are on your own, and you
think it can kill you…just saying. Water Monitor image: https://ianbcross.wordpress.
com/2014/05/24/water-monitor-lizard/. Komodo monitorimage: http://content.time.com/time/
magazine/article/0,9171,1989139,00.html
10 Earthquake-Driven Coastal Change: Ghost Forests, Graveyards…