

114
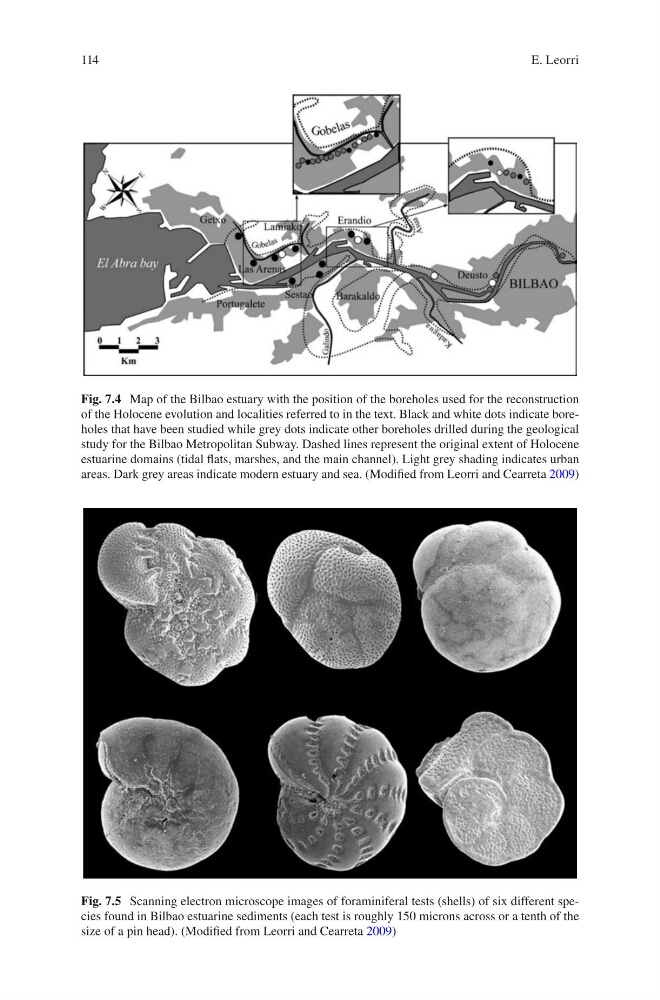
Fig. 7.4 Map of the Bilbao estuary with the position of the boreholes used for the reconstruction
of the Holocene evolution and localities referred to in the text. Black and white dots indicate boreholes that have been studied while grey dots indicate other boreholes drilled during the geological
study for the Bilbao Metropolitan Subway. Dashed lines represent the original extent of Holocene
estuarine domains (tidal flats, marshes, and the main channel). Light grey shading indicates urban
areas. Dark grey areas indicate modern estuary and sea. (Modified from Leorri and Cearreta 2009)
Fig. 7.5 Scanning electron microscope images of foraminiferal tests (shells) of six different species found in Bilbao estuarine sediments (each test is roughly 150 microns across or a tenth of the
size of a pin head). (Modified from Leorri and Cearreta 2009)
E. Leorri
Fig. 7.4 Map of the Bilbao estuary with the position of the boreholes used for the reconstruction
of the Holocene evolution and localities referred to in the text. Black and white dots indicate boreholes that have been studied while grey dots indicate other boreholes drilled during the geological
study for the Bilbao Metropolitan Subway. Dashed lines represent the original extent of Holocene
estuarine domains (tidal flats, marshes, and the main channel). Light grey shading indicates urban
areas. Dark grey areas indicate modern estuary and sea. (Modified from Leorri and Cearreta 2009)
Fig. 7.5 Scanning electron microscope images of foraminiferal tests (shells) of six different species found in Bilbao estuarine sediments (each test is roughly 150 microns across or a tenth of the
size of a pin head). (Modified from Leorri and Cearreta 2009)
E. Leorri