

101
collected all the time around the world. As you read this chapter, there are dozens,
maybe hundreds, of ships from the Arctic to the Southern Ocean, mapping the seafloor. Some are “mowing the lawn” as part of a formal survey (which can be rather
monotonous) while others are just collecting data as the vessel transits from port A
to port B. If you want to see what an expedition is like, you can now experience
them virtually through “telepresence” with the University of Rhode Island’s Inner
Space Center (http://innerspacecenter.org/); mapping and seafloor exploration is
regularly livestreamed from local and remote areas of the ocean. There is a global
push now to map the entire ocean by 2030 – a grand goal. However, with so many
ships now crossing the seas, and new autonomous platform coming online (e.g.,
competitors for the Shell Ocean Discovery XPRISE teams, https://oceandiscovery.
xprize.org/prizes/ocean-discovery), this aspiration is not so unrealistic. A great
challenge will be integrating so much information from disparate sources, but the
Seabed 2030 effort appears to be well-orchestrated and already having success.
Today, we have systems that beam lasers to map elevations very precisely, and
when coupled with extremely accurate GPS (known as real-time kinetic or RTK
GPS), it is possible to map coastlines and structures to centimeters of precision.
Additionally, we have many types of optical and acoustic sensors mounted on
drones or underwater platforms that enable us to map at very fine (several centimeters or less) or over large scales with satellite data. A variety of remote-controlled
vehicles (i.e., robots with cameras or other sensors) can now accurately and quickly
survey sites during or after events, giving invaluable insights on impacts. “Seeing”
the coastal landscape and seascape with its subtle topography, often masked by
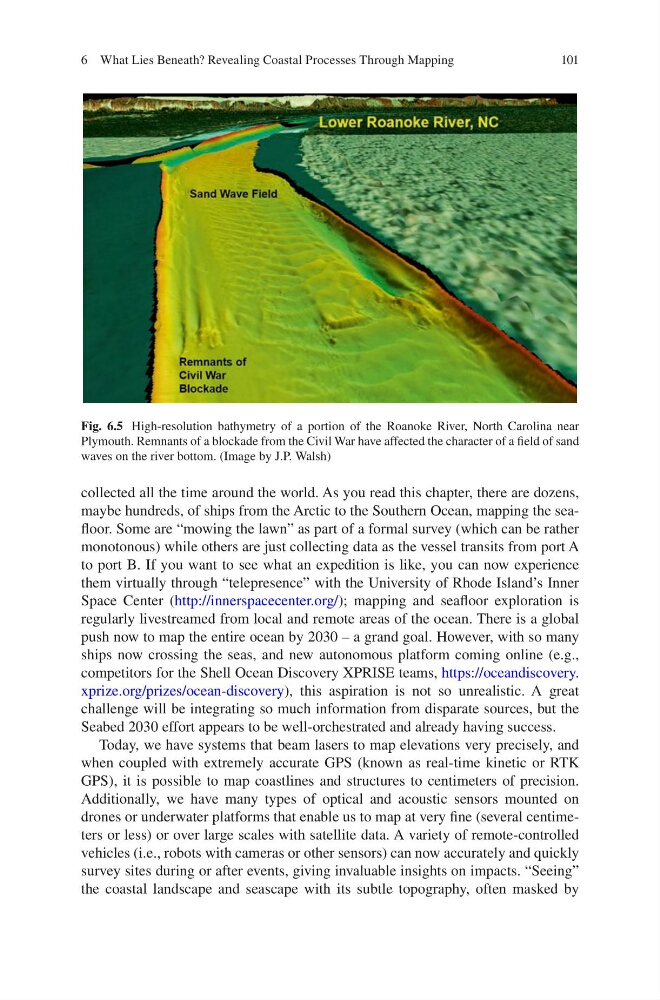
Fig. 6.5 High-resolution bathymetry of a portion of the Roanoke River, North Carolina near
Plymouth. Remnants of a blockade from the Civil War have affected the character of a field of sand
waves on the river bottom. (Image by J.P. Walsh)
6 What Lies Beneath? Revealing Coastal Processes Through Mapping
collected all the time around the world. As you read this chapter, there are dozens,
maybe hundreds, of ships from the Arctic to the Southern Ocean, mapping the seafloor. Some are “mowing the lawn” as part of a formal survey (which can be rather
monotonous) while others are just collecting data as the vessel transits from port A
to port B. If you want to see what an expedition is like, you can now experience
them virtually through “telepresence” with the University of Rhode Island’s Inner
Space Center (http://innerspacecenter.org/); mapping and seafloor exploration is
regularly livestreamed from local and remote areas of the ocean. There is a global
push now to map the entire ocean by 2030 – a grand goal. However, with so many
ships now crossing the seas, and new autonomous platform coming online (e.g.,
competitors for the Shell Ocean Discovery XPRISE teams, https://oceandiscovery.
xprize.org/prizes/ocean-discovery), this aspiration is not so unrealistic. A great
challenge will be integrating so much information from disparate sources, but the
Seabed 2030 effort appears to be well-orchestrated and already having success.
Today, we have systems that beam lasers to map elevations very precisely, and
when coupled with extremely accurate GPS (known as real-time kinetic or RTK
GPS), it is possible to map coastlines and structures to centimeters of precision.
Additionally, we have many types of optical and acoustic sensors mounted on
drones or underwater platforms that enable us to map at very fine (several centimeters or less) or over large scales with satellite data. A variety of remote-controlled
vehicles (i.e., robots with cameras or other sensors) can now accurately and quickly
survey sites during or after events, giving invaluable insights on impacts. “Seeing”
the coastal landscape and seascape with its subtle topography, often masked by
Fig. 6.5 High-resolution bathymetry of a portion of the Roanoke River, North Carolina near
Plymouth. Remnants of a blockade from the Civil War have affected the character of a field of sand
waves on the river bottom. (Image by J.P. Walsh)
6 What Lies Beneath? Revealing Coastal Processes Through Mapping