

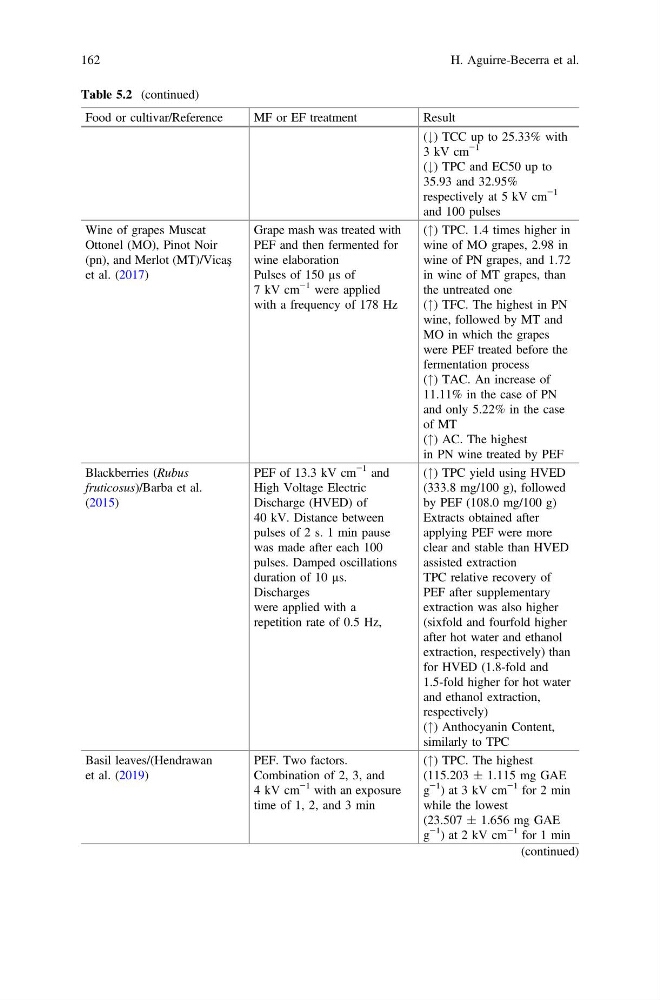
Table 5.2 (continued)
Food or cultivar/Reference
MF or EF treatment
Result
(#) TCC up to 25.33% with
3 kV cm
−1
(#) TPC and EC50 up to
35.93 and 32.95%
respectively at 5 kV cm
−1
and 100 pulses
Wine of grapes Muscat
Ottonel (MO), Pinot Noir
(pn), and Merlot (MT)/Vicaş
et al. (2017)
Grape mash was treated with
PEF and then fermented for
wine elaboration
Pulses of 150 µs of
7 kV cm
−1 were applied
with a frequency of 178 Hz
(") TPC. 1.4 times higher in
wine of MO grapes, 2.98 in
wine of PN grapes, and 1.72
in wine of MT grapes, than
the untreated one
(") TFC. The highest in PN
wine, followed by MT and
MO in which the grapes
were PEF treated before the
fermentation process
(") TAC. An increase of
11.11% in the case of PN
and only 5.22% in the case
of MT
(") AC. The highest
in PN wine treated by PEF
Blackberries (Rubus
fruticosus)/Barba et al.
(2015)
PEF of 13.3 kV cm
−1 and
High Voltage Electric
Discharge (HVED) of
40 kV. Distance between
pulses of 2 s. 1 min pause
was made after each 100
pulses. Damped oscillations
duration of 10 µs.
Discharges
were applied with a
repetition rate of 0.5 Hz,
(") TPC yield using HVED
(333.8 mg/100 g), followed
by PEF (108.0 mg/100 g)
Extracts obtained after
applying PEF were more
clear and stable than HVED
assisted extraction
TPC relative recovery of
PEF after supplementary
extraction was also higher
(sixfold and fourfold higher
after hot water and ethanol
extraction, respectively) than
for HVED (1.8-fold and
1.5-fold higher for hot water
and ethanol extraction,
respectively)
(") Anthocyanin Content,
similarly to TPC
Basil leaves/(Hendrawan
et al. (2019)
PEF. Two factors.
Combination of 2, 3, and
4 kV cm
−1 with an exposure
time of 1, 2, and 3 min
(") TPC. The highest
(115.203 ± 1.115 mg GAE
g
−1
) at 3 kV cm
−1 for 2 min
while the lowest
(23.507 ± 1.656 mg GAE
g
−1
) at 2 kV cm
−1 for 1 min
(continued)
162
H. Aguirre-Becerra et al.
Food or cultivar/Reference
MF or EF treatment
Result
(#) TCC up to 25.33% with
3 kV cm
−1
(#) TPC and EC50 up to
35.93 and 32.95%
respectively at 5 kV cm
−1
and 100 pulses
Wine of grapes Muscat
Ottonel (MO), Pinot Noir
(pn), and Merlot (MT)/Vicaş
et al. (2017)
Grape mash was treated with
PEF and then fermented for
wine elaboration
Pulses of 150 µs of
7 kV cm
−1 were applied
with a frequency of 178 Hz
(") TPC. 1.4 times higher in
wine of MO grapes, 2.98 in
wine of PN grapes, and 1.72
in wine of MT grapes, than
the untreated one
(") TFC. The highest in PN
wine, followed by MT and
MO in which the grapes
were PEF treated before the
fermentation process
(") TAC. An increase of
11.11% in the case of PN
and only 5.22% in the case
of MT
(") AC. The highest
in PN wine treated by PEF
Blackberries (Rubus
fruticosus)/Barba et al.
(2015)
PEF of 13.3 kV cm
−1 and
High Voltage Electric
Discharge (HVED) of
40 kV. Distance between
pulses of 2 s. 1 min pause
was made after each 100
pulses. Damped oscillations
duration of 10 µs.
Discharges
were applied with a
repetition rate of 0.5 Hz,
(") TPC yield using HVED
(333.8 mg/100 g), followed
by PEF (108.0 mg/100 g)
Extracts obtained after
applying PEF were more
clear and stable than HVED
assisted extraction
TPC relative recovery of
PEF after supplementary
extraction was also higher
(sixfold and fourfold higher
after hot water and ethanol
extraction, respectively) than
for HVED (1.8-fold and
1.5-fold higher for hot water
and ethanol extraction,
respectively)
(") Anthocyanin Content,
similarly to TPC
Basil leaves/(Hendrawan
et al. (2019)
PEF. Two factors.
Combination of 2, 3, and
4 kV cm
−1 with an exposure
time of 1, 2, and 3 min
(") TPC. The highest
(115.203 ± 1.115 mg GAE
g
−1
) at 3 kV cm
−1 for 2 min
while the lowest
(23.507 ± 1.656 mg GAE
g
−1
) at 2 kV cm
−1 for 1 min
(continued)
162
H. Aguirre-Becerra et al.