

710
T. Liao et al.
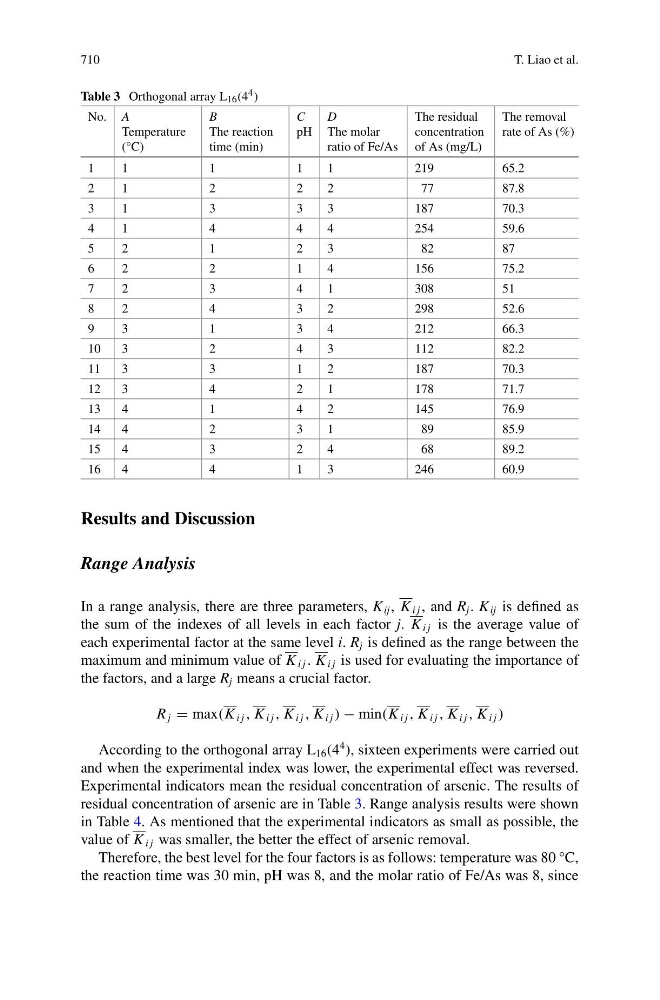
Table 3 Orthogonal array L 16 (4 4 )
No. A
Temperature
(°C)
B
The reaction
time (min)
C
pH
D
The molar
ratio of Fe/As
The residual
concentration
of As (mg/L)
The removal
rate of As (%)
1
1
1
1
1
219
65.2
2
1
2
2
2
77
87.8
3
1
3
3
3
187
70.3
4
1
4
4
4
254
59.6
5
2
1
2
3
82
87
6
2
2
1
4
156
75.2
7
2
3
4
1
308
51
8
2
4
3
2
298
52.6
9
3
1
3
4
212
66.3
10
3
2
4
3
112
82.2
11
3
3
1
2
187
70.3
12
3
4
2
1
178
71.7
13
4
1
4
2
145
76.9
14
4
2
3
1
89
85.9
15
4
3
2
4
68
89.2
16
4
4
1
3
246
60.9
Results and Discussion
Range Analysis
In a range analysis, there are three parameters, K ij , K i j , and R j . K ij is defined as
the sum of the indexes of all levels in each factor j. K i j is the average value of
each experimental factor at the same level i. R j is defined as the range between the
maximum and minimum value of K i j . K i j is used for evaluating the importance of
the factors, and a large R j means a crucial factor.
R j = max(K i j , K i j , K i j , K i j ) − min(K i j , K i j , K i j , K i j )
According to the orthogonal array L 16 (4
4 ), sixteen experiments were carried out
and when the experimental index was lower, the experimental effect was reversed.
Experimental indicators mean the residual concentration of arsenic. The results of
residual concentration of arsenic are in Table 3. Range analysis results were shown
in Table 4. As mentioned that the experimental indicators as small as possible, the
value of K i j was smaller, the better the effect of arsenic removal.
Therefore, the best level for the four factors is as follows: temperature was 80 °C,
the reaction time was 30 min, pH was 8, and the molar ratio of Fe/As was 8, since