

412
C. C. S. de Oliveira and D. D. Pereira
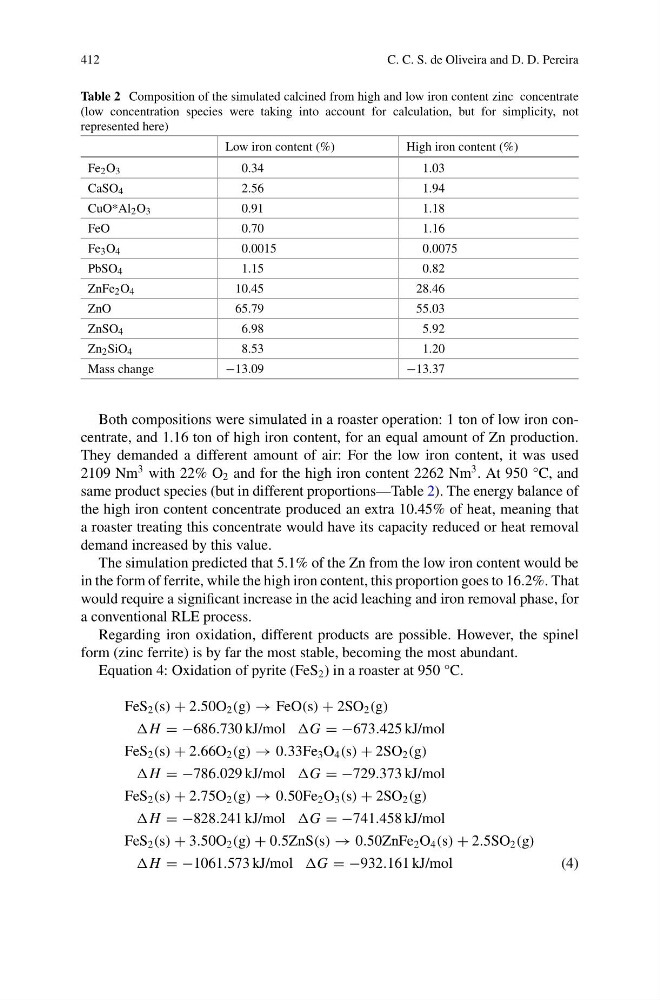
Table 2 Composition of the simulated calcined from high and low iron content zinc concentrate
(low concentration species were taking into account for calculation, but for simplicity, not
represented here)
Low iron content (%)
High iron content (%)
Fe 2 O 3
0.34
1.03
CaSO 4
2.56
1.94
CuO*Al 2 O 3
0.91
1.18
FeO
0.70
1.16
Fe 3 O 4
0.0015
0.0075
PbSO 4
1.15
0.82
ZnFe 2 O 4
10.45
28.46
ZnO
65.79
55.03
ZnSO 4
6.98
5.92
Zn 2 SiO 4
8.53
1.20
Mass change
−13.09
−13.37
Both compositions were simulated in a roaster operation: 1 ton of low iron concentrate, and 1.16 ton of high iron content, for an equal amount of Zn production.
They demanded a different amount of air: For the low iron content, it was used
2109 Nm
3 with 22% O 2 and for the high iron content 2262 Nm
3 . At 950 °C, and
same product species (but in different proportions—Table 2). The energy balance of
the high iron content concentrate produced an extra 10.45% of heat, meaning that
a roaster treating this concentrate would have its capacity reduced or heat removal
demand increased by this value.
The simulation predicted that 5.1% of the Zn from the low iron content would be
in the form of ferrite, while the high iron content, this proportion goes to 16.2%. That
would require a significant increase in the acid leaching and iron removal phase, for
a conventional RLE process.
Regarding iron oxidation, different products are possible. However, the spinel
form (zinc ferrite) is by far the most stable, becoming the most abundant.
Equation 4: Oxidation of pyrite (FeS 2 ) in a roaster at 950 °C.
FeS 2 (s) + 2.50O 2 (g) → FeO(s) + 2SO 2 (g)
H = −686.730 kJ/mol G = −673.425 kJ/mol
FeS 2 (s) + 2.66O 2 (g) → 0.33Fe 3 O 4 (s) + 2SO 2 (g)
H = −786.029 kJ/mol G = −729.373 kJ/mol
FeS 2 (s) + 2.75O 2 (g) → 0.50Fe 2 O 3 (s) + 2SO 2 (g)
H = −828.241 kJ/mol G = −741.458 kJ/mol
FeS 2 (s) + 3.50O 2 (g) + 0.5ZnS(s) → 0.50ZnFe 2 O 4 (s) + 2.5SO 2 (g)
H = −1061.573 kJ/mol G = −932.161 kJ/mol
(4)
C. C. S. de Oliveira and D. D. Pereira
Table 2 Composition of the simulated calcined from high and low iron content zinc concentrate
(low concentration species were taking into account for calculation, but for simplicity, not
represented here)
Low iron content (%)
High iron content (%)
Fe 2 O 3
0.34
1.03
CaSO 4
2.56
1.94
CuO*Al 2 O 3
0.91
1.18
FeO
0.70
1.16
Fe 3 O 4
0.0015
0.0075
PbSO 4
1.15
0.82
ZnFe 2 O 4
10.45
28.46
ZnO
65.79
55.03
ZnSO 4
6.98
5.92
Zn 2 SiO 4
8.53
1.20
Mass change
−13.09
−13.37
Both compositions were simulated in a roaster operation: 1 ton of low iron concentrate, and 1.16 ton of high iron content, for an equal amount of Zn production.
They demanded a different amount of air: For the low iron content, it was used
2109 Nm
3 with 22% O 2 and for the high iron content 2262 Nm
3 . At 950 °C, and
same product species (but in different proportions—Table 2). The energy balance of
the high iron content concentrate produced an extra 10.45% of heat, meaning that
a roaster treating this concentrate would have its capacity reduced or heat removal
demand increased by this value.
The simulation predicted that 5.1% of the Zn from the low iron content would be
in the form of ferrite, while the high iron content, this proportion goes to 16.2%. That
would require a significant increase in the acid leaching and iron removal phase, for
a conventional RLE process.
Regarding iron oxidation, different products are possible. However, the spinel
form (zinc ferrite) is by far the most stable, becoming the most abundant.
Equation 4: Oxidation of pyrite (FeS 2 ) in a roaster at 950 °C.
FeS 2 (s) + 2.50O 2 (g) → FeO(s) + 2SO 2 (g)
H = −686.730 kJ/mol G = −673.425 kJ/mol
FeS 2 (s) + 2.66O 2 (g) → 0.33Fe 3 O 4 (s) + 2SO 2 (g)
H = −786.029 kJ/mol G = −729.373 kJ/mol
FeS 2 (s) + 2.75O 2 (g) → 0.50Fe 2 O 3 (s) + 2SO 2 (g)
H = −828.241 kJ/mol G = −741.458 kJ/mol
FeS 2 (s) + 3.50O 2 (g) + 0.5ZnS(s) → 0.50ZnFe 2 O 4 (s) + 2.5SO 2 (g)
H = −1061.573 kJ/mol G = −932.161 kJ/mol
(4)