

Experience with Digital Process Optimization of Zinc Roasting …
385
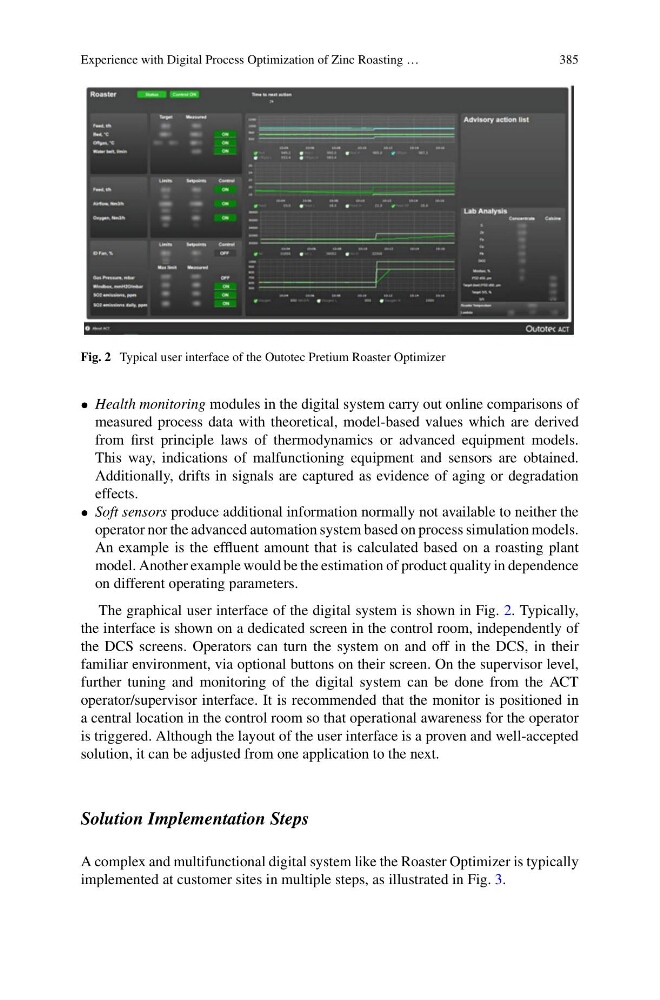
Fig. 2 Typical user interface of the Outotec Pretium Roaster Optimizer
• Health monitoring modules in the digital system carry out online comparisons of
measured process data with theoretical, model-based values which are derived
from first principle laws of thermodynamics or advanced equipment models.
This way, indications of malfunctioning equipment and sensors are obtained.
Additionally, drifts in signals are captured as evidence of aging or degradation
effects.
• Soft sensors produce additional information normally not available to neither the
operator nor the advanced automation system based on process simulation models.
An example is the effluent amount that is calculated based on a roasting plant
model. Another example would be the estimation of product quality in dependence
on different operating parameters.
The graphical user interface of the digital system is shown in Fig. 2. Typically,
the interface is shown on a dedicated screen in the control room, independently of
the DCS screens. Operators can turn the system on and off in the DCS, in their
familiar environment, via optional buttons on their screen. On the supervisor level,
further tuning and monitoring of the digital system can be done from the ACT
operator/supervisor interface. It is recommended that the monitor is positioned in
a central location in the control room so that operational awareness for the operator
is triggered. Although the layout of the user interface is a proven and well-accepted
solution, it can be adjusted from one application to the next.
Solution Implementation Steps
A complex and multifunctional digital system like the Roaster Optimizer is typically
implemented at customer sites in multiple steps, as illustrated in Fig. 3.
385
Fig. 2 Typical user interface of the Outotec Pretium Roaster Optimizer
• Health monitoring modules in the digital system carry out online comparisons of
measured process data with theoretical, model-based values which are derived
from first principle laws of thermodynamics or advanced equipment models.
This way, indications of malfunctioning equipment and sensors are obtained.
Additionally, drifts in signals are captured as evidence of aging or degradation
effects.
• Soft sensors produce additional information normally not available to neither the
operator nor the advanced automation system based on process simulation models.
An example is the effluent amount that is calculated based on a roasting plant
model. Another example would be the estimation of product quality in dependence
on different operating parameters.
The graphical user interface of the digital system is shown in Fig. 2. Typically,
the interface is shown on a dedicated screen in the control room, independently of
the DCS screens. Operators can turn the system on and off in the DCS, in their
familiar environment, via optional buttons on their screen. On the supervisor level,
further tuning and monitoring of the digital system can be done from the ACT
operator/supervisor interface. It is recommended that the monitor is positioned in
a central location in the control room so that operational awareness for the operator
is triggered. Although the layout of the user interface is a proven and well-accepted
solution, it can be adjusted from one application to the next.
Solution Implementation Steps
A complex and multifunctional digital system like the Roaster Optimizer is typically
implemented at customer sites in multiple steps, as illustrated in Fig. 3.