

346
E. Jak et al.
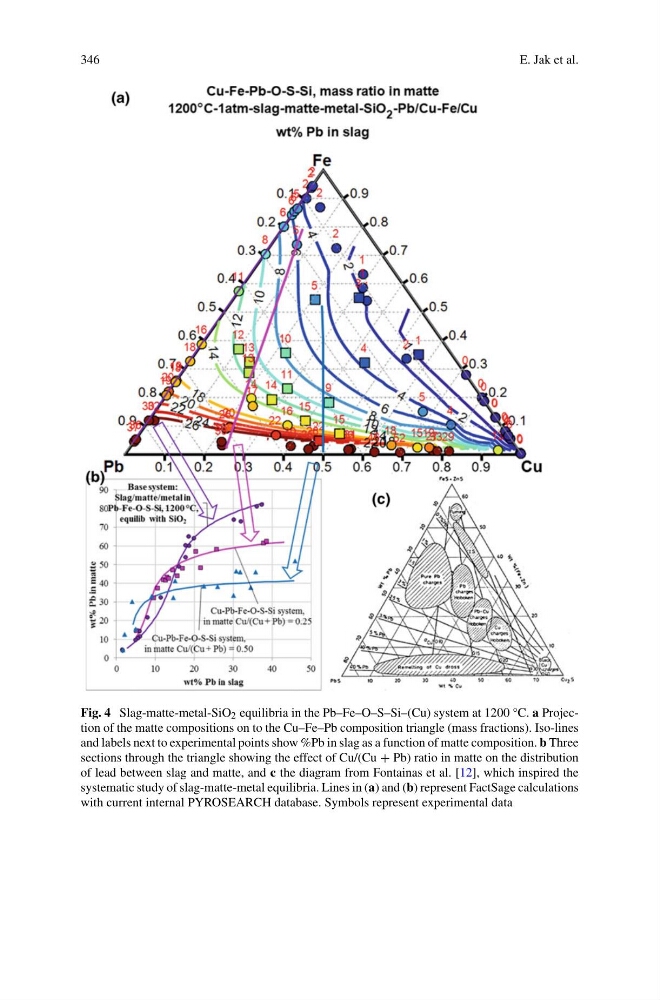
Fig. 4 Slag-matte-metal-SiO 2 equilibria in the Pb–Fe–O–S–Si–(Cu) system at 1200 °C. a Projection of the matte compositions on to the Cu–Fe–Pb composition triangle (mass fractions). Iso-lines
and labels next to experimental points show %Pb in slag as a function of matte composition. b Three
sections through the triangle showing the effect of Cu/(Cu + Pb) ratio in matte on the distribution
of lead between slag and matte, and c the diagram from Fontainas et al. [12], which inspired the
systematic study of slag-matte-metal equilibria. Lines in (a) and (b) represent FactSage calculations
with current internal PYROSEARCH database. Symbols represent experimental data
E. Jak et al.
Fig. 4 Slag-matte-metal-SiO 2 equilibria in the Pb–Fe–O–S–Si–(Cu) system at 1200 °C. a Projection of the matte compositions on to the Cu–Fe–Pb composition triangle (mass fractions). Iso-lines
and labels next to experimental points show %Pb in slag as a function of matte composition. b Three
sections through the triangle showing the effect of Cu/(Cu + Pb) ratio in matte on the distribution
of lead between slag and matte, and c the diagram from Fontainas et al. [12], which inspired the
systematic study of slag-matte-metal equilibria. Lines in (a) and (b) represent FactSage calculations
with current internal PYROSEARCH database. Symbols represent experimental data