

Optimizing Additive Ratios in Alkaline Zincate Electrodeposition
127
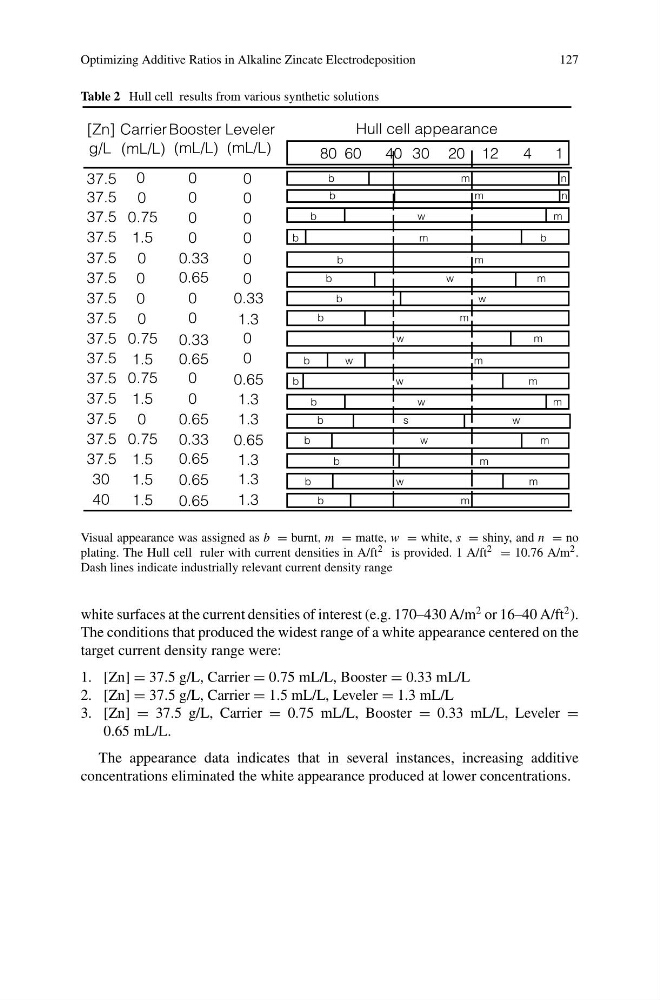
Table 2 Hull cell results from various synthetic solutions
37.5
0.75
0.75
0.75
0.75
0
0
0
0
0
0.33
0.65
0.65
0.65
0.33
0.33
0.33
0.65
0.65
0.65
0.65
0.65
0
0
0
0
0
0
0
0
0
0
0
0
0
0
0
0
0
0
1.5
1.5
1.5
1.3
1.3
1.3
1.3
1.3
1.3
1.5
1.5
1.5
37.5
37.5
37.5
37.5
37.5
37.5
37.5
37.5
37.5
37.5
37.5
37.5
37.5
37.5
40
30
[Zn]
g/L
Carrier
(mL/L) (mL/L) (mL/L)
Booster Leveler
Hull cell appearance
80 60
40 30 20 12
4
1
b
b
b
b
b
b
b
b
b
b
w
w
m
m
m
m
n
n
m
m
m
m
m
m
m
m
m
m
m
w
w
w
w
w
w
w
s
w
b
b
b
b
b
b
b
Visual appearance was assigned as b = burnt, m = matte, w = white, s = shiny, and n = no
plating. The Hull cell ruler with current densities in A/ft 2 is provided. 1 A/ft 2 = 10.76 A/m 2 .
Dash lines indicate industrially relevant current density range
white surfaces at the current densities of interest (e.g. 170–430 A/m
2 or 16–40 A/ft
2 ).
The conditions that produced the widest range of a white appearance centered on the
target current density range were:
1. [Zn] = 37.5 g/L, Carrier = 0.75 mL/L, Booster = 0.33 mL/L
2. [Zn] = 37.5 g/L, Carrier = 1.5 mL/L, Leveler = 1.3 mL/L
3. [Zn] = 37.5 g/L, Carrier = 0.75 mL/L, Booster = 0.33 mL/L, Leveler =
0.65 mL/L.
The appearance data indicates that in several instances, increasing additive
concentrations eliminated the white appearance produced at lower concentrations.
127
Table 2 Hull cell results from various synthetic solutions
37.5
0.75
0.75
0.75
0.75
0
0
0
0
0
0.33
0.65
0.65
0.65
0.33
0.33
0.33
0.65
0.65
0.65
0.65
0.65
0
0
0
0
0
0
0
0
0
0
0
0
0
0
0
0
0
0
1.5
1.5
1.5
1.3
1.3
1.3
1.3
1.3
1.3
1.5
1.5
1.5
37.5
37.5
37.5
37.5
37.5
37.5
37.5
37.5
37.5
37.5
37.5
37.5
37.5
37.5
40
30
[Zn]
g/L
Carrier
(mL/L) (mL/L) (mL/L)
Booster Leveler
Hull cell appearance
80 60
40 30 20 12
4
1
b
b
b
b
b
b
b
b
b
b
w
w
m
m
m
m
n
n
m
m
m
m
m
m
m
m
m
m
m
w
w
w
w
w
w
w
s
w
b
b
b
b
b
b
b
Visual appearance was assigned as b = burnt, m = matte, w = white, s = shiny, and n = no
plating. The Hull cell ruler with current densities in A/ft 2 is provided. 1 A/ft 2 = 10.76 A/m 2 .
Dash lines indicate industrially relevant current density range
white surfaces at the current densities of interest (e.g. 170–430 A/m
2 or 16–40 A/ft
2 ).
The conditions that produced the widest range of a white appearance centered on the
target current density range were:
1. [Zn] = 37.5 g/L, Carrier = 0.75 mL/L, Booster = 0.33 mL/L
2. [Zn] = 37.5 g/L, Carrier = 1.5 mL/L, Leveler = 1.3 mL/L
3. [Zn] = 37.5 g/L, Carrier = 0.75 mL/L, Booster = 0.33 mL/L, Leveler =
0.65 mL/L.
The appearance data indicates that in several instances, increasing additive
concentrations eliminated the white appearance produced at lower concentrations.