

108
J. A. de Lima et al.
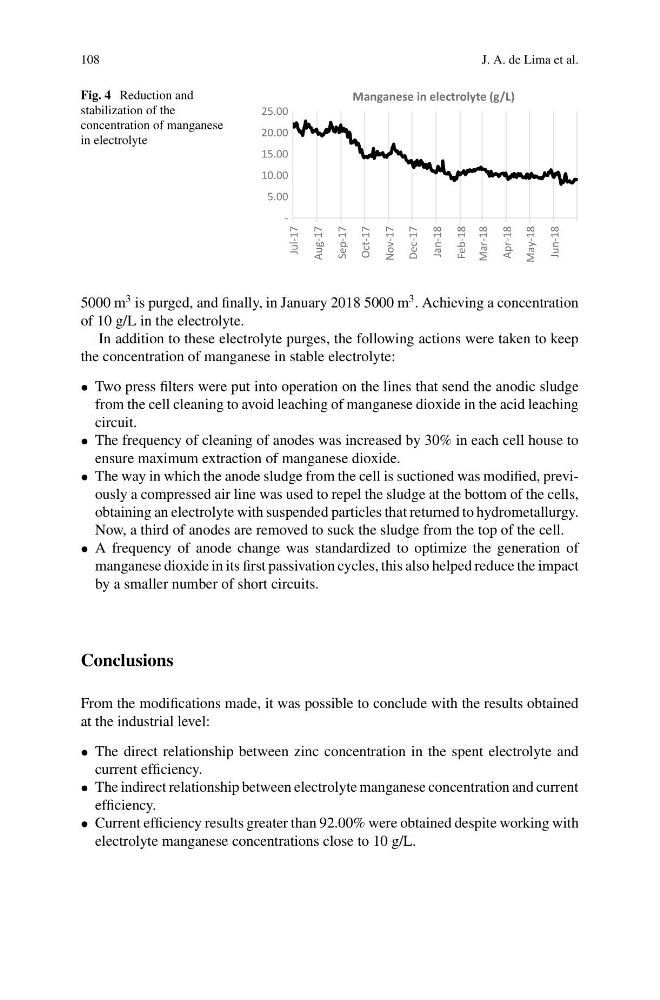
Fig. 4 Reduction and
stabilization of the
concentration of manganese
in electrolyte
-
5.00
10.00
15.00
20.00
25.00
Jul-17
Aug-17
Sep-17
Oct-17
Nov-17
Dec-17
Jan-18
Feb-18
Mar-18
Apr-18
May-18
Jun-18
Manganese in electrolyte (g/L)
5000 m
3 is purged, and finally, in January 2018 5000 m
3 . Achieving a concentration
of 10 g/L in the electrolyte.
In addition to these electrolyte purges, the following actions were taken to keep
the concentration of manganese in stable electrolyte:
• Two press filters were put into operation on the lines that send the anodic sludge
from the cell cleaning to avoid leaching of manganese dioxide in the acid leaching
circuit.
• The frequency of cleaning of anodes was increased by 30% in each cell house to
ensure maximum extraction of manganese dioxide.
• The way in which the anode sludge from the cell is suctioned was modified, previously a compressed air line was used to repel the sludge at the bottom of the cells,
obtaining an electrolyte with suspended particles that returned to hydrometallurgy.
Now, a third of anodes are removed to suck the sludge from the top of the cell.
• A frequency of anode change was standardized to optimize the generation of
manganese dioxide in its first passivation cycles, this also helped reduce the impact
by a smaller number of short circuits.
Conclusions
From the modifications made, it was possible to conclude with the results obtained
at the industrial level:
• The direct relationship between zinc concentration in the spent electrolyte and
current efficiency.
• The indirect relationship between electrolyte manganese concentration and current
efficiency.
• Current efficiency results greater than 92.00% were obtained despite working with
electrolyte manganese concentrations close to 10 g/L.
J. A. de Lima et al.
Fig. 4 Reduction and
stabilization of the
concentration of manganese
in electrolyte
-
5.00
10.00
15.00
20.00
25.00
Jul-17
Aug-17
Sep-17
Oct-17
Nov-17
Dec-17
Jan-18
Feb-18
Mar-18
Apr-18
May-18
Jun-18
Manganese in electrolyte (g/L)
5000 m
3 is purged, and finally, in January 2018 5000 m
3 . Achieving a concentration
of 10 g/L in the electrolyte.
In addition to these electrolyte purges, the following actions were taken to keep
the concentration of manganese in stable electrolyte:
• Two press filters were put into operation on the lines that send the anodic sludge
from the cell cleaning to avoid leaching of manganese dioxide in the acid leaching
circuit.
• The frequency of cleaning of anodes was increased by 30% in each cell house to
ensure maximum extraction of manganese dioxide.
• The way in which the anode sludge from the cell is suctioned was modified, previously a compressed air line was used to repel the sludge at the bottom of the cells,
obtaining an electrolyte with suspended particles that returned to hydrometallurgy.
Now, a third of anodes are removed to suck the sludge from the top of the cell.
• A frequency of anode change was standardized to optimize the generation of
manganese dioxide in its first passivation cycles, this also helped reduce the impact
by a smaller number of short circuits.
Conclusions
From the modifications made, it was possible to conclude with the results obtained
at the industrial level:
• The direct relationship between zinc concentration in the spent electrolyte and
current efficiency.
• The indirect relationship between electrolyte manganese concentration and current
efficiency.
• Current efficiency results greater than 92.00% were obtained despite working with
electrolyte manganese concentrations close to 10 g/L.