

96
6 Applications of Carbon Nanostructures Produced in Molten Salts
a linear adsorption. Finally, the values 0 < R L < 1 show a favorable adsorption, and an
R L value equals to zero indicates an irreversible adsorption process. In Eq. (6.4), C 0
is the highest (initial) MO concentration and K L is the Langmuir adsorption constant
(L mg
−1 ). It can be seen from Table 6.3 that R L has values within the range of zero
and unity, indicating that the graphite and the molten salt-produced graphene are both
favorable for the adsorption of MO dye under the experimental conditions used.
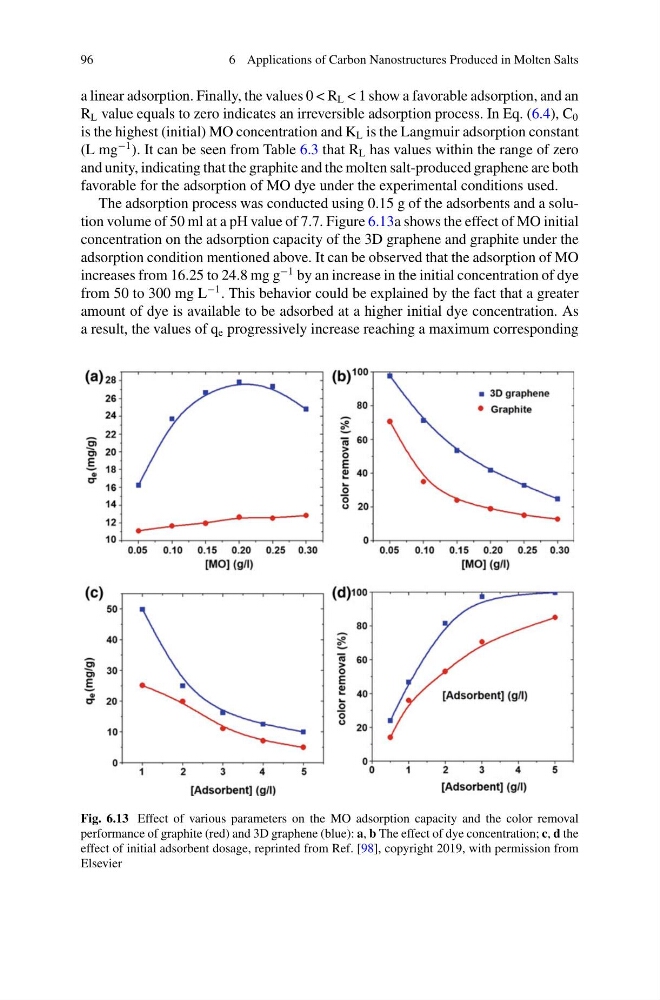
The adsorption process was conducted using 0.15 g of the adsorbents and a solution volume of 50 ml at a pH value of 7.7. Figure 6.13a shows the effect of MO initial
concentration on the adsorption capacity of the 3D graphene and graphite under the
adsorption condition mentioned above. It can be observed that the adsorption of MO
increases from 16.25 to 24.8 mg g
−1 by an increase in the initial concentration of dye
from 50 to 300 mg L
−1 . This behavior could be explained by the fact that a greater
amount of dye is available to be adsorbed at a higher initial dye concentration. As
a result, the values of q e progressively increase reaching a maximum corresponding
Fig. 6.13 Effect of various parameters on the MO adsorption capacity and the color removal
performance of graphite (red) and 3D graphene (blue): a, b The effect of dye concentration; c, d the
effect of initial adsorbent dosage, reprinted from Ref. [98], copyright 2019, with permission from
Elsevier
6 Applications of Carbon Nanostructures Produced in Molten Salts
a linear adsorption. Finally, the values 0 < R L < 1 show a favorable adsorption, and an
R L value equals to zero indicates an irreversible adsorption process. In Eq. (6.4), C 0
is the highest (initial) MO concentration and K L is the Langmuir adsorption constant
(L mg
−1 ). It can be seen from Table 6.3 that R L has values within the range of zero
and unity, indicating that the graphite and the molten salt-produced graphene are both
favorable for the adsorption of MO dye under the experimental conditions used.
The adsorption process was conducted using 0.15 g of the adsorbents and a solution volume of 50 ml at a pH value of 7.7. Figure 6.13a shows the effect of MO initial
concentration on the adsorption capacity of the 3D graphene and graphite under the
adsorption condition mentioned above. It can be observed that the adsorption of MO
increases from 16.25 to 24.8 mg g
−1 by an increase in the initial concentration of dye
from 50 to 300 mg L
−1 . This behavior could be explained by the fact that a greater
amount of dye is available to be adsorbed at a higher initial dye concentration. As
a result, the values of q e progressively increase reaching a maximum corresponding
Fig. 6.13 Effect of various parameters on the MO adsorption capacity and the color removal
performance of graphite (red) and 3D graphene (blue): a, b The effect of dye concentration; c, d the
effect of initial adsorbent dosage, reprinted from Ref. [98], copyright 2019, with permission from
Elsevier