

0.7
Throughput (flits/cycle/IP)
0.0
0.3
Locality factor
0.5
0.8
0.6
0.5
0.4
0.3
0.2
0.1
0.0
1000
800
600
400
200
0 0.002 0.004 0.006 0.008 0.010 0.012 0.014 0.016
Offered load (packets/cycle/IP)
LF = 0.0
LF = 0.3
LF = 0.5
LF = 0.8
Average overall latency
(number of clock cycles)
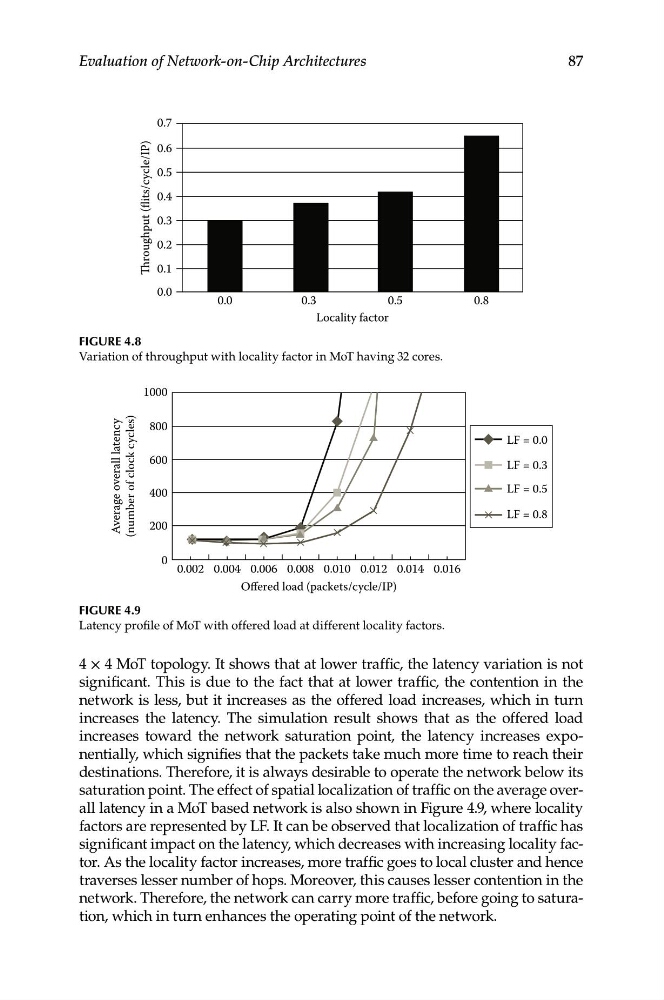
Figure 4.8
Variation of throughput with locality factor in MoT having 32 cores.
87
Evaluation of Network-on-Chip Architectures
Figure 4.9
Latency profile of MoT with offered load at different locality factors.
4 × 4 MoT topology. It shows that at lower traffic, the latency variation is not
significant. This is due to the fact that at lower traffic, the contention in the
network is less, but it increases as the offered load increases, which in turn
increases the latency. The simulation result shows that as the offered load
increases toward the network saturation point, the latency increases exponentially, which signifies that the packets take much more time to reach their
destinations. Therefore, it is always desirable to operate the network below its
saturation point. The effect of spatial localization of traffic on the average overall latency in a MoT based network is also shown in Figure 4.9, where locality
factors are represented by LF. It can be observed that localization of traffic has
significant impact on the latency, which decreases with increasing locality factor. As the locality factor increases, more traffic goes to local cluster and hence
traverses lesser number of hops. Moreover, this causes lesser contention in the
network. Therefore, the network can carry more traffic, before going to saturation, which in turn enhances the operating point of the network.
Throughput (flits/cycle/IP)
0.0
0.3
Locality factor
0.5
0.8
0.6
0.5
0.4
0.3
0.2
0.1
0.0
1000
800
600
400
200
0 0.002 0.004 0.006 0.008 0.010 0.012 0.014 0.016
Offered load (packets/cycle/IP)
LF = 0.0
LF = 0.3
LF = 0.5
LF = 0.8
Average overall latency
(number of clock cycles)
Figure 4.8
Variation of throughput with locality factor in MoT having 32 cores.
87
Evaluation of Network-on-Chip Architectures
Figure 4.9
Latency profile of MoT with offered load at different locality factors.
4 × 4 MoT topology. It shows that at lower traffic, the latency variation is not
significant. This is due to the fact that at lower traffic, the contention in the
network is less, but it increases as the offered load increases, which in turn
increases the latency. The simulation result shows that as the offered load
increases toward the network saturation point, the latency increases exponentially, which signifies that the packets take much more time to reach their
destinations. Therefore, it is always desirable to operate the network below its
saturation point. The effect of spatial localization of traffic on the average overall latency in a MoT based network is also shown in Figure 4.9, where locality
factors are represented by LF. It can be observed that localization of traffic has
significant impact on the latency, which decreases with increasing locality factor. As the locality factor increases, more traffic goes to local cluster and hence
traverses lesser number of hops. Moreover, this causes lesser contention in the
network. Therefore, the network can carry more traffic, before going to saturation, which in turn enhances the operating point of the network.