

FLAME’s Future
281
(a)
(b)
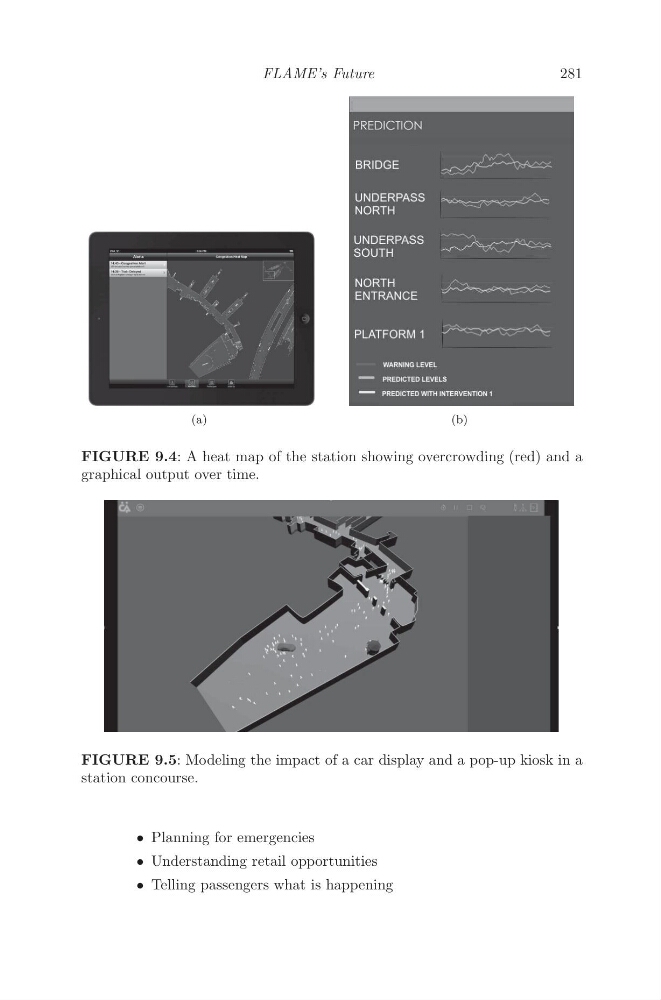
FIGURE 9.4: A heat map of the station showing overcrowding (red) and a
graphical output over time.
FIGURE 9.5: Modeling the impact of a car display and a pop-up kiosk in a
station concourse.
• Planning for emergencies
• Understanding retail opportunities
• Telling passengers what is happening
281
(a)
(b)
FIGURE 9.4: A heat map of the station showing overcrowding (red) and a
graphical output over time.
FIGURE 9.5: Modeling the impact of a car display and a pop-up kiosk in a
station concourse.
• Planning for emergencies
• Understanding retail opportunities
• Telling passengers what is happening