

240
X-Machines for Agent-Based Modeling: FLAME Perspectives
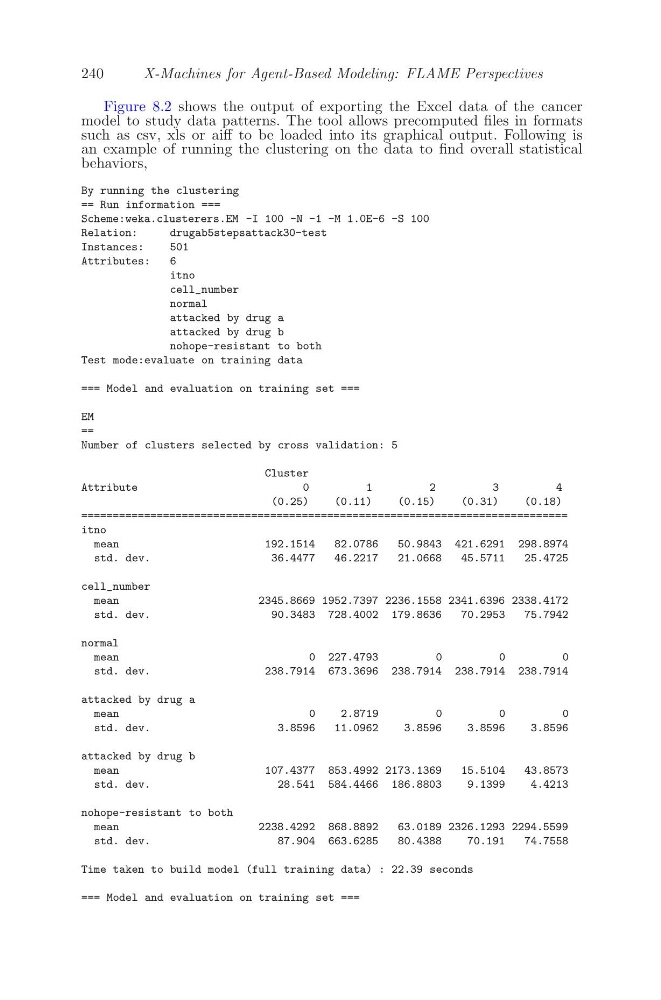
Figure 8.2 shows the output of exporting the Excel data of the cancer
model to study data patterns. The tool allows precomputed files in formats
such as csv, xls or aiff to be loaded into its graphical output. Following is
an example of running the clustering on the data to find overall statistical
behaviors,
By running the clustering
== Run information ===
Scheme:weka.clusterers.EM -I 100 -N -1 -M 1.0E-6 -S 100
Relation:
drugab5stepsattack30-test
Instances:
501
Attributes:
6
itno
cell_number
normal
attacked by drug a
attacked by drug b
nohope-resistant to both
Test mode:evaluate on training data
=== Model and evaluation on training set ===
EM
==
Number of clusters selected by cross validation: 5
Cluster
Attribute
0
1
2
3
4
(0.25)
(0.11)
(0.15)
(0.31)
(0.18)
=============================================================================
itno
mean
192.1514
82.0786
50.9843 421.6291 298.8974
std. dev.
36.4477
46.2217
21.0668
45.5711
25.4725
cell_number
mean
2345.8669 1952.7397 2236.1558 2341.6396 2338.4172
std. dev.
90.3483 728.4002 179.8636
70.2953
75.7942
normal
mean
0 227.4793
0
0
0
std. dev.
238.7914 673.3696 238.7914 238.7914 238.7914
attacked by drug a
mean
0
2.8719
0
0
0
std. dev.
3.8596
11.0962
3.8596
3.8596
3.8596
attacked by drug b
mean
107.4377 853.4992 2173.1369
15.5104
43.8573
std. dev.
28.541 584.4466 186.8803
9.1399
4.4213
nohope-resistant to both
mean
2238.4292 868.8892
63.0189 2326.1293 2294.5599
std. dev.
87.904 663.6285
80.4388
70.191
74.7558
Time taken to build model (full training data) : 22.39 seconds
=== Model and evaluation on training set ===
X-Machines for Agent-Based Modeling: FLAME Perspectives
Figure 8.2 shows the output of exporting the Excel data of the cancer
model to study data patterns. The tool allows precomputed files in formats
such as csv, xls or aiff to be loaded into its graphical output. Following is
an example of running the clustering on the data to find overall statistical
behaviors,
By running the clustering
== Run information ===
Scheme:weka.clusterers.EM -I 100 -N -1 -M 1.0E-6 -S 100
Relation:
drugab5stepsattack30-test
Instances:
501
Attributes:
6
itno
cell_number
normal
attacked by drug a
attacked by drug b
nohope-resistant to both
Test mode:evaluate on training data
=== Model and evaluation on training set ===
EM
==
Number of clusters selected by cross validation: 5
Cluster
Attribute
0
1
2
3
4
(0.25)
(0.11)
(0.15)
(0.31)
(0.18)
=============================================================================
itno
mean
192.1514
82.0786
50.9843 421.6291 298.8974
std. dev.
36.4477
46.2217
21.0668
45.5711
25.4725
cell_number
mean
2345.8669 1952.7397 2236.1558 2341.6396 2338.4172
std. dev.
90.3483 728.4002 179.8636
70.2953
75.7942
normal
mean
0 227.4793
0
0
0
std. dev.
238.7914 673.3696 238.7914 238.7914 238.7914
attacked by drug a
mean
0
2.8719
0
0
0
std. dev.
3.8596
11.0962
3.8596
3.8596
3.8596
attacked by drug b
mean
107.4377 853.4992 2173.1369
15.5104
43.8573
std. dev.
28.541 584.4466 186.8803
9.1399
4.4213
nohope-resistant to both
mean
2238.4292 868.8892
63.0189 2326.1293 2294.5599
std. dev.
87.904 663.6285
80.4388
70.191
74.7558
Time taken to build model (full training data) : 22.39 seconds
=== Model and evaluation on training set ===