

Agents in Economic Markets and Games
155
0
5
10
15
20
25
30
0
50
100
150
200
Wages
Time
Group 1
Group 2
Group 3
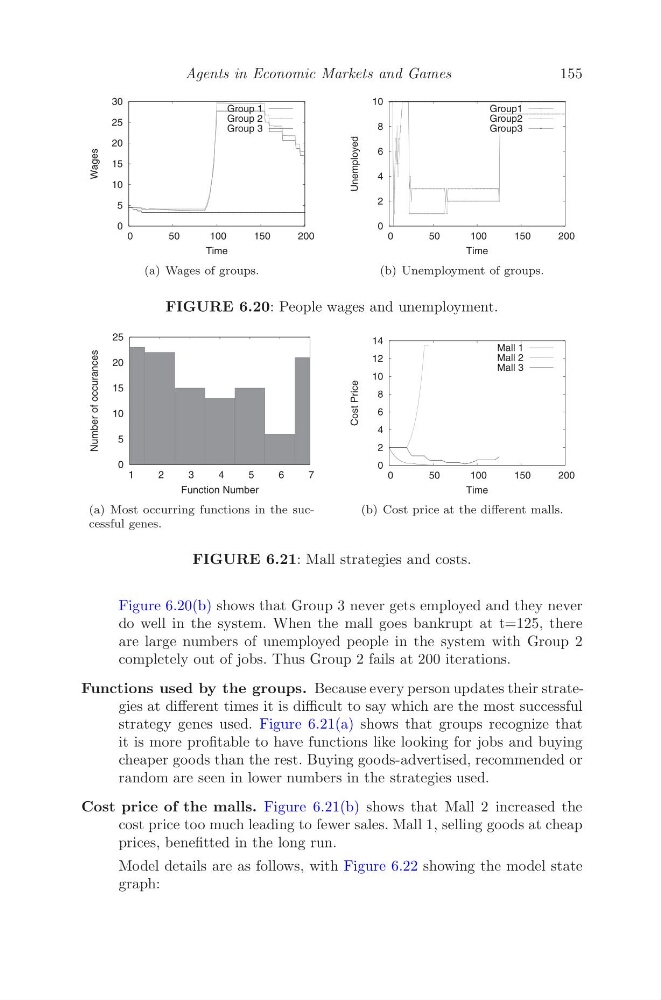
(a) Wages of groups.
0
2
4
6
8
10
0
50
100
150
200
Unemployed
Time
Group1
Group2
Group3
(b) Unemployment of groups.
FIGURE 6.20: People wages and unemployment.
0
5
10
15
20
25
1
2
3
4
5
6
7
Number of occurances
Function Number
(a) Most occurring functions in the successful genes.
0
2
4
6
8
10
12
14
0
50
100
150
200
Cost Price
Time
Mall 1
Mall 2
Mall 3
(b) Cost price at the different malls.
FIGURE 6.21: Mall strategies and costs.
Figure 6.20(b) shows that Group 3 never gets employed and they never
do well in the system. When the mall goes bankrupt at t=125, there
are large numbers of unemployed people in the system with Group 2
completely out of jobs. Thus Group 2 fails at 200 iterations.
Functions used by the groups. Because every person updates their strategies at different times it is difficult to say which are the most successful
strategy genes used. Figure 6.21(a) shows that groups recognize that
it is more profitable to have functions like looking for jobs and buying
cheaper goods than the rest. Buying goods-advertised, recommended or
random are seen in lower numbers in the strategies used.
Cost price of the malls. Figure 6.21(b) shows that Mall 2 increased the
cost price too much leading to fewer sales. Mall 1, selling goods at cheap
prices, benefitted in the long run.
Model details are as follows, with Figure 6.22 showing the model state
graph:
155
0
5
10
15
20
25
30
0
50
100
150
200
Wages
Time
Group 1
Group 2
Group 3
(a) Wages of groups.
0
2
4
6
8
10
0
50
100
150
200
Unemployed
Time
Group1
Group2
Group3
(b) Unemployment of groups.
FIGURE 6.20: People wages and unemployment.
0
5
10
15
20
25
1
2
3
4
5
6
7
Number of occurances
Function Number
(a) Most occurring functions in the successful genes.
0
2
4
6
8
10
12
14
0
50
100
150
200
Cost Price
Time
Mall 1
Mall 2
Mall 3
(b) Cost price at the different malls.
FIGURE 6.21: Mall strategies and costs.
Figure 6.20(b) shows that Group 3 never gets employed and they never
do well in the system. When the mall goes bankrupt at t=125, there
are large numbers of unemployed people in the system with Group 2
completely out of jobs. Thus Group 2 fails at 200 iterations.
Functions used by the groups. Because every person updates their strategies at different times it is difficult to say which are the most successful
strategy genes used. Figure 6.21(a) shows that groups recognize that
it is more profitable to have functions like looking for jobs and buying
cheaper goods than the rest. Buying goods-advertised, recommended or
random are seen in lower numbers in the strategies used.
Cost price of the malls. Figure 6.21(b) shows that Mall 2 increased the
cost price too much leading to fewer sales. Mall 1, selling goods at cheap
prices, benefitted in the long run.
Model details are as follows, with Figure 6.22 showing the model state
graph: