

128
X-Machines for Agent-Based Modeling: FLAME Perspectives
0
100
200
300
400
500
600
0
20
40
60
80
100
Average Savings of Customers
Time
Random buyers
Favourite shop buyers
Others favourite buyers
Shoplifters
Cheapest shop buyers
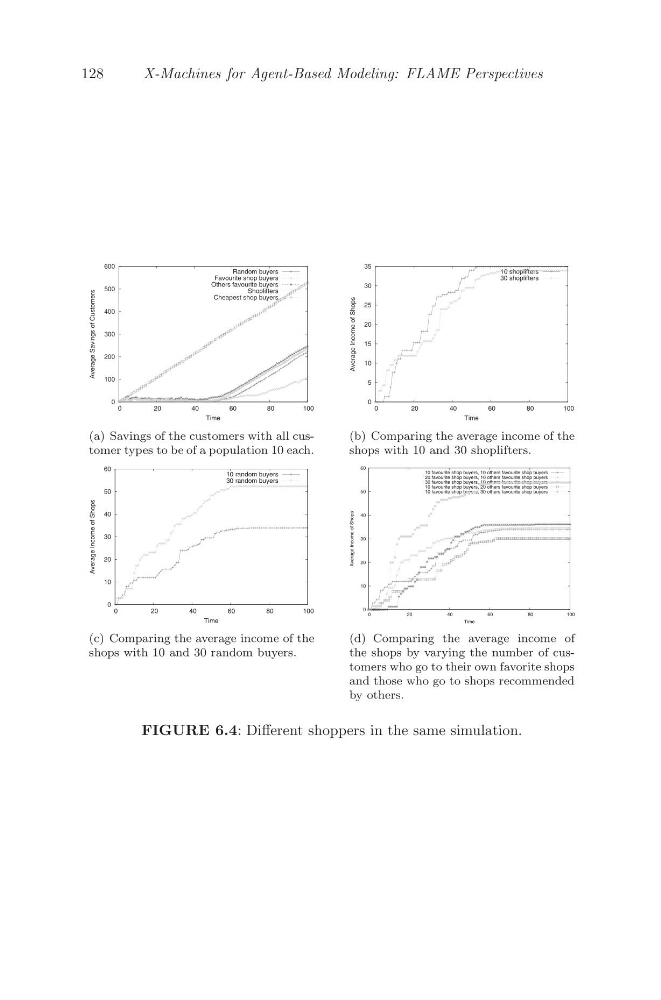
(a) Savings of the customers with all customer types to be of a population 10 each.
0
5
10
15
20
25
30
35
0
20
40
60
80
100
Average Income of Shops
Time
10 shoplifters
30 shoplifters
(b) Comparing the average income of the
shops with 10 and 30 shoplifters.
0
10
20
30
40
50
60
0
20
40
60
80
100
Average Income of Shops
Time
10 random buyers
30 random buyers
(c) Comparing the average income of the
shops with 10 and 30 random buyers.
0
10
20
30
40
50
60
0
20
40
60
80
100
Average Income of Shops
Time
10 favourite shop buyers, 10 others favourite shop buyers
20 favourite shop buyers, 10 others favourite shop buyers
30 favourite shop buyers, 10 others favourite shop buyers
10 favourite shop buyers, 20 others favourite shop buyers
10 favourite shop buyers, 30 others favourite shop buyers
(d) Comparing the average income of
the shops by varying the number of customers who go to their own favorite shops
and those who go to shops recommended
by others.
FIGURE 6.4: Different shoppers in the same simulation.
X-Machines for Agent-Based Modeling: FLAME Perspectives
0
100
200
300
400
500
600
0
20
40
60
80
100
Average Savings of Customers
Time
Random buyers
Favourite shop buyers
Others favourite buyers
Shoplifters
Cheapest shop buyers
(a) Savings of the customers with all customer types to be of a population 10 each.
0
5
10
15
20
25
30
35
0
20
40
60
80
100
Average Income of Shops
Time
10 shoplifters
30 shoplifters
(b) Comparing the average income of the
shops with 10 and 30 shoplifters.
0
10
20
30
40
50
60
0
20
40
60
80
100
Average Income of Shops
Time
10 random buyers
30 random buyers
(c) Comparing the average income of the
shops with 10 and 30 random buyers.
0
10
20
30
40
50
60
0
20
40
60
80
100
Average Income of Shops
Time
10 favourite shop buyers, 10 others favourite shop buyers
20 favourite shop buyers, 10 others favourite shop buyers
30 favourite shop buyers, 10 others favourite shop buyers
10 favourite shop buyers, 20 others favourite shop buyers
10 favourite shop buyers, 30 others favourite shop buyers
(d) Comparing the average income of
the shops by varying the number of customers who go to their own favorite shops
and those who go to shops recommended
by others.
FIGURE 6.4: Different shoppers in the same simulation.