

M-SERVE and P-SERVE
83
0
50
100
150
200
250
SERVE side size ( µm)
SERVE side size ( µm)
0
0.2
0.4
0.6
0.8
KS test of number of twins
(a)
0
50
100
150
200
250
0
0.2
0.4
0.6
0.8
1
KS test of twin thickness
(b)
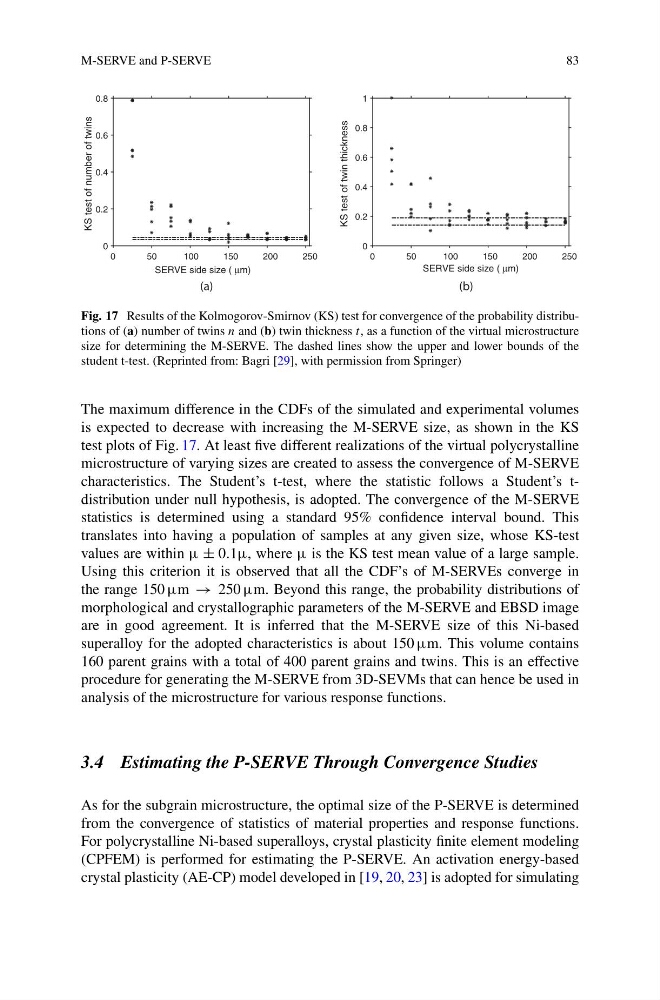
Fig. 17 Results of the Kolmogorov-Smirnov (KS) test for convergence of the probability distributions of (a) number of twins n and (b) twin thickness t, as a function of the virtual microstructure
size for determining the M-SERVE. The dashed lines show the upper and lower bounds of the
student t-test. (Reprinted from: Bagri [29], with permission from Springer)
The maximum difference in the CDFs of the simulated and experimental volumes
is expected to decrease with increasing the M-SERVE size, as shown in the KS
test plots of Fig. 17. At least five different realizations of the virtual polycrystalline
microstructure of varying sizes are created to assess the convergence of M-SERVE
characteristics. The Student’s t-test, where the statistic follows a Student’s tdistribution under null hypothesis, is adopted. The convergence of the M-SERVE
statistics is determined using a standard 95% confidence interval bound. This
translates into having a population of samples at any given size, whose KS-test
values are within μ ± 0.1μ, where μ is the KS test mean value of a large sample.
Using this criterion it is observed that all the CDF’s of M-SERVEs converge in
the range 150 μm → 250 μm. Beyond this range, the probability distributions of
morphological and crystallographic parameters of the M-SERVE and EBSD image
are in good agreement. It is inferred that the M-SERVE size of this Ni-based
superalloy for the adopted characteristics is about 150 μm. This volume contains
160 parent grains with a total of 400 parent grains and twins. This is an effective
procedure for generating the M-SERVE from 3D-SEVMs that can hence be used in
analysis of the microstructure for various response functions.
3.4 Estimating the P-SERVE Through Convergence Studies
As for the subgrain microstructure, the optimal size of the P-SERVE is determined
from the convergence of statistics of material properties and response functions.
For polycrystalline Ni-based superalloys, crystal plasticity finite element modeling
(CPFEM) is performed for estimating the P-SERVE. An activation energy-based
crystal plasticity (AE-CP) model developed in [19, 20, 23] is adopted for simulating
83
0
50
100
150
200
250
SERVE side size ( µm)
SERVE side size ( µm)
0
0.2
0.4
0.6
0.8
KS test of number of twins
(a)
0
50
100
150
200
250
0
0.2
0.4
0.6
0.8
1
KS test of twin thickness
(b)
Fig. 17 Results of the Kolmogorov-Smirnov (KS) test for convergence of the probability distributions of (a) number of twins n and (b) twin thickness t, as a function of the virtual microstructure
size for determining the M-SERVE. The dashed lines show the upper and lower bounds of the
student t-test. (Reprinted from: Bagri [29], with permission from Springer)
The maximum difference in the CDFs of the simulated and experimental volumes
is expected to decrease with increasing the M-SERVE size, as shown in the KS
test plots of Fig. 17. At least five different realizations of the virtual polycrystalline
microstructure of varying sizes are created to assess the convergence of M-SERVE
characteristics. The Student’s t-test, where the statistic follows a Student’s tdistribution under null hypothesis, is adopted. The convergence of the M-SERVE
statistics is determined using a standard 95% confidence interval bound. This
translates into having a population of samples at any given size, whose KS-test
values are within μ ± 0.1μ, where μ is the KS test mean value of a large sample.
Using this criterion it is observed that all the CDF’s of M-SERVEs converge in
the range 150 μm → 250 μm. Beyond this range, the probability distributions of
morphological and crystallographic parameters of the M-SERVE and EBSD image
are in good agreement. It is inferred that the M-SERVE size of this Ni-based
superalloy for the adopted characteristics is about 150 μm. This volume contains
160 parent grains with a total of 400 parent grains and twins. This is an effective
procedure for generating the M-SERVE from 3D-SEVMs that can hence be used in
analysis of the microstructure for various response functions.
3.4 Estimating the P-SERVE Through Convergence Studies
As for the subgrain microstructure, the optimal size of the P-SERVE is determined
from the convergence of statistics of material properties and response functions.
For polycrystalline Ni-based superalloys, crystal plasticity finite element modeling
(CPFEM) is performed for estimating the P-SERVE. An activation energy-based
crystal plasticity (AE-CP) model developed in [19, 20, 23] is adopted for simulating