

278
X. Wu and J. A. El-Awady
Specific Volume (%)
250
300
350
400
450
500
0.5
1.0
1.5
2.0
Temperature (K)
360
400
440
480
520
0%
20%
40%
60%
80% 100%
Conversion degree
T (K)
g
3501-6 simulation
Epon 825 simulation
3501-6 fitting
Epon 825 fitting
a
b
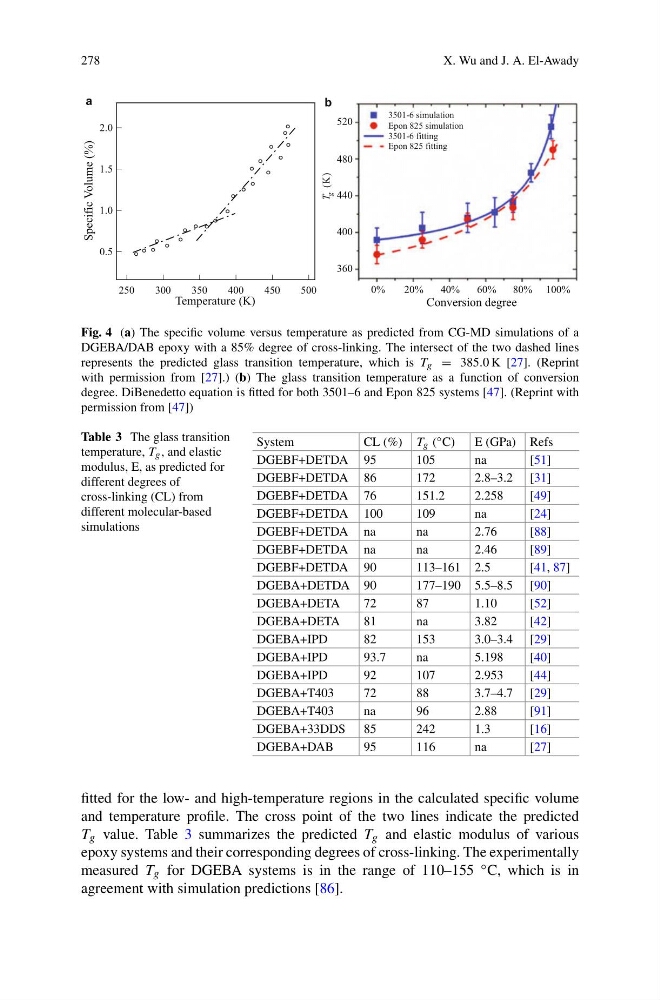
Fig. 4 (a) The specific volume versus temperature as predicted from CG-MD simulations of a
DGEBA/DAB epoxy with a 85% degree of cross-linking. The intersect of the two dashed lines
represents the predicted glass transition temperature, which is T g = 385.0 K [27]. (Reprint
with permission from [27].) (b) The glass transition temperature as a function of conversion
degree. DiBenedetto equation is fitted for both 3501–6 and Epon 825 systems [47]. (Reprint with
permission from [47])
Table 3 The glass transition
temperature, T g , and elastic
modulus, E, as predicted for
different degrees of
cross-linking (CL) from
different molecular-based
simulations
System
CL (%) T g ( ◦ C)
E (GPa) Refs
DGEBF+DETDA 95
105
na
[51]
DGEBF+DETDA 86
172
2.8–3.2 [31]
DGEBF+DETDA 76
151.2
2.258
[49]
DGEBF+DETDA 100
109
na
[24]
DGEBF+DETDA na
na
2.76
[88]
DGEBF+DETDA na
na
2.46
[89]
DGEBF+DETDA 90
113–161 2.5
[41, 87]
DGEBA+DETDA 90
177–190 5.5–8.5 [90]
DGEBA+DETA
72
87
1.10
[52]
DGEBA+DETA
81
na
3.82
[42]
DGEBA+IPD
82
153
3.0–3.4 [29]
DGEBA+IPD
93.7
na
5.198
[40]
DGEBA+IPD
92
107
2.953
[44]
DGEBA+T403
72
88
3.7–4.7 [29]
DGEBA+T403
na
96
2.88
[91]
DGEBA+33DDS 85
242
1.3
[16]
DGEBA+DAB
95
116
na
[27]
fitted for the low- and high-temperature regions in the calculated specific volume
and temperature profile. The cross point of the two lines indicate the predicted
T g value. Table 3 summarizes the predicted T g and elastic modulus of various
epoxy systems and their corresponding degrees of cross-linking. The experimentally
measured T g for DGEBA systems is in the range of 110–155 ◦ C, which is in
agreement with simulation predictions [86].
X. Wu and J. A. El-Awady
Specific Volume (%)
250
300
350
400
450
500
0.5
1.0
1.5
2.0
Temperature (K)
360
400
440
480
520
0%
20%
40%
60%
80% 100%
Conversion degree
T (K)
g
3501-6 simulation
Epon 825 simulation
3501-6 fitting
Epon 825 fitting
a
b
Fig. 4 (a) The specific volume versus temperature as predicted from CG-MD simulations of a
DGEBA/DAB epoxy with a 85% degree of cross-linking. The intersect of the two dashed lines
represents the predicted glass transition temperature, which is T g = 385.0 K [27]. (Reprint
with permission from [27].) (b) The glass transition temperature as a function of conversion
degree. DiBenedetto equation is fitted for both 3501–6 and Epon 825 systems [47]. (Reprint with
permission from [47])
Table 3 The glass transition
temperature, T g , and elastic
modulus, E, as predicted for
different degrees of
cross-linking (CL) from
different molecular-based
simulations
System
CL (%) T g ( ◦ C)
E (GPa) Refs
DGEBF+DETDA 95
105
na
[51]
DGEBF+DETDA 86
172
2.8–3.2 [31]
DGEBF+DETDA 76
151.2
2.258
[49]
DGEBF+DETDA 100
109
na
[24]
DGEBF+DETDA na
na
2.76
[88]
DGEBF+DETDA na
na
2.46
[89]
DGEBF+DETDA 90
113–161 2.5
[41, 87]
DGEBA+DETDA 90
177–190 5.5–8.5 [90]
DGEBA+DETA
72
87
1.10
[52]
DGEBA+DETA
81
na
3.82
[42]
DGEBA+IPD
82
153
3.0–3.4 [29]
DGEBA+IPD
93.7
na
5.198
[40]
DGEBA+IPD
92
107
2.953
[44]
DGEBA+T403
72
88
3.7–4.7 [29]
DGEBA+T403
na
96
2.88
[91]
DGEBA+33DDS 85
242
1.3
[16]
DGEBA+DAB
95
116
na
[27]
fitted for the low- and high-temperature regions in the calculated specific volume
and temperature profile. The cross point of the two lines indicate the predicted
T g value. Table 3 summarizes the predicted T g and elastic modulus of various
epoxy systems and their corresponding degrees of cross-linking. The experimentally
measured T g for DGEBA systems is in the range of 110–155 ◦ C, which is in
agreement with simulation predictions [86].