

12
M. P. Echlin et al.
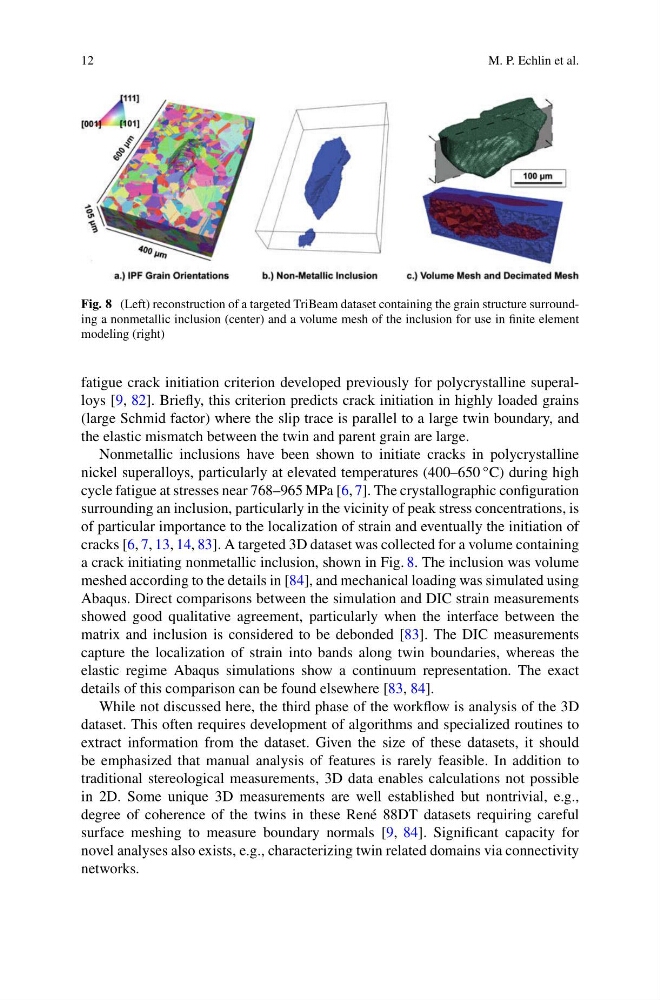
Fig. 8 (Left) reconstruction of a targeted TriBeam dataset containing the grain structure surrounding a nonmetallic inclusion (center) and a volume mesh of the inclusion for use in finite element
modeling (right)
fatigue crack initiation criterion developed previously for polycrystalline superalloys [9, 82]. Briefly, this criterion predicts crack initiation in highly loaded grains
(large Schmid factor) where the slip trace is parallel to a large twin boundary, and
the elastic mismatch between the twin and parent grain are large.
Nonmetallic inclusions have been shown to initiate cracks in polycrystalline
nickel superalloys, particularly at elevated temperatures (400–650 ◦ C) during high
cycle fatigue at stresses near 768–965 MPa [6, 7]. The crystallographic configuration
surrounding an inclusion, particularly in the vicinity of peak stress concentrations, is
of particular importance to the localization of strain and eventually the initiation of
cracks [6, 7, 13, 14, 83]. A targeted 3D dataset was collected for a volume containing
a crack initiating nonmetallic inclusion, shown in Fig. 8. The inclusion was volume
meshed according to the details in [84], and mechanical loading was simulated using
Abaqus. Direct comparisons between the simulation and DIC strain measurements
showed good qualitative agreement, particularly when the interface between the
matrix and inclusion is considered to be debonded [83]. The DIC measurements
capture the localization of strain into bands along twin boundaries, whereas the
elastic regime Abaqus simulations show a continuum representation. The exact
details of this comparison can be found elsewhere [83, 84].
While not discussed here, the third phase of the workflow is analysis of the 3D
dataset. This often requires development of algorithms and specialized routines to
extract information from the dataset. Given the size of these datasets, it should
be emphasized that manual analysis of features is rarely feasible. In addition to
traditional stereological measurements, 3D data enables calculations not possible
in 2D. Some unique 3D measurements are well established but nontrivial, e.g.,
degree of coherence of the twins in these René 88DT datasets requiring careful
surface meshing to measure boundary normals [9, 84]. Significant capacity for
novel analyses also exists, e.g., characterizing twin related domains via connectivity
networks.
M. P. Echlin et al.
Fig. 8 (Left) reconstruction of a targeted TriBeam dataset containing the grain structure surrounding a nonmetallic inclusion (center) and a volume mesh of the inclusion for use in finite element
modeling (right)
fatigue crack initiation criterion developed previously for polycrystalline superalloys [9, 82]. Briefly, this criterion predicts crack initiation in highly loaded grains
(large Schmid factor) where the slip trace is parallel to a large twin boundary, and
the elastic mismatch between the twin and parent grain are large.
Nonmetallic inclusions have been shown to initiate cracks in polycrystalline
nickel superalloys, particularly at elevated temperatures (400–650 ◦ C) during high
cycle fatigue at stresses near 768–965 MPa [6, 7]. The crystallographic configuration
surrounding an inclusion, particularly in the vicinity of peak stress concentrations, is
of particular importance to the localization of strain and eventually the initiation of
cracks [6, 7, 13, 14, 83]. A targeted 3D dataset was collected for a volume containing
a crack initiating nonmetallic inclusion, shown in Fig. 8. The inclusion was volume
meshed according to the details in [84], and mechanical loading was simulated using
Abaqus. Direct comparisons between the simulation and DIC strain measurements
showed good qualitative agreement, particularly when the interface between the
matrix and inclusion is considered to be debonded [83]. The DIC measurements
capture the localization of strain into bands along twin boundaries, whereas the
elastic regime Abaqus simulations show a continuum representation. The exact
details of this comparison can be found elsewhere [83, 84].
While not discussed here, the third phase of the workflow is analysis of the 3D
dataset. This often requires development of algorithms and specialized routines to
extract information from the dataset. Given the size of these datasets, it should
be emphasized that manual analysis of features is rarely feasible. In addition to
traditional stereological measurements, 3D data enables calculations not possible
in 2D. Some unique 3D measurements are well established but nontrivial, e.g.,
degree of coherence of the twins in these René 88DT datasets requiring careful
surface meshing to measure boundary normals [9, 84]. Significant capacity for
novel analyses also exists, e.g., characterizing twin related domains via connectivity
networks.