

A Framework for Quantifying Effects of Characterization Error on the. . .
231
simulation and the total number of features varied, but typically ∼1000 features
were used for the determination of error, ensuring good statistical convergence. The
results illustrate several key observations and demonstrate how the framework is
useful in analyzing different types of error.
3.1 Step 3: Error Measurements
One of the primary motivations of the proposed framework is the ability to explicitly
compute various error metrics. Using the phantom microstructure as a baseline, one
measure of error is the percent of mismatched voxels (MMV) defined as:
MMV =
l
i=1
m
j =1
n
k=1 P (i, j, k) = S(i, j, k)
lmn
(2)
where, P , the phantom, and S, the simulation, are l × m × n matrices of general
microstructural properties voxel such as crystal orientation or phase assignments.
Other measures can address error in statistical quantities that describe features of
the microstructure, such as the grain size distribution:
L 2 =
n
i=1 [P gs (x i ) − S gs (x i )] 2
n
i=1 P gs (x i ) 2
(3)
where P gs (x i ) and S gs (x i ) are the CDFs of grain size x i for the phantom and
simulation, respectively, and n is the total number of grain sizes considered. Another
measure of error is the number of lost features, which occurs when none of the
voxels in the reconstructed microstructure are assigned the address associated with
a feature in the phantom microstructure.
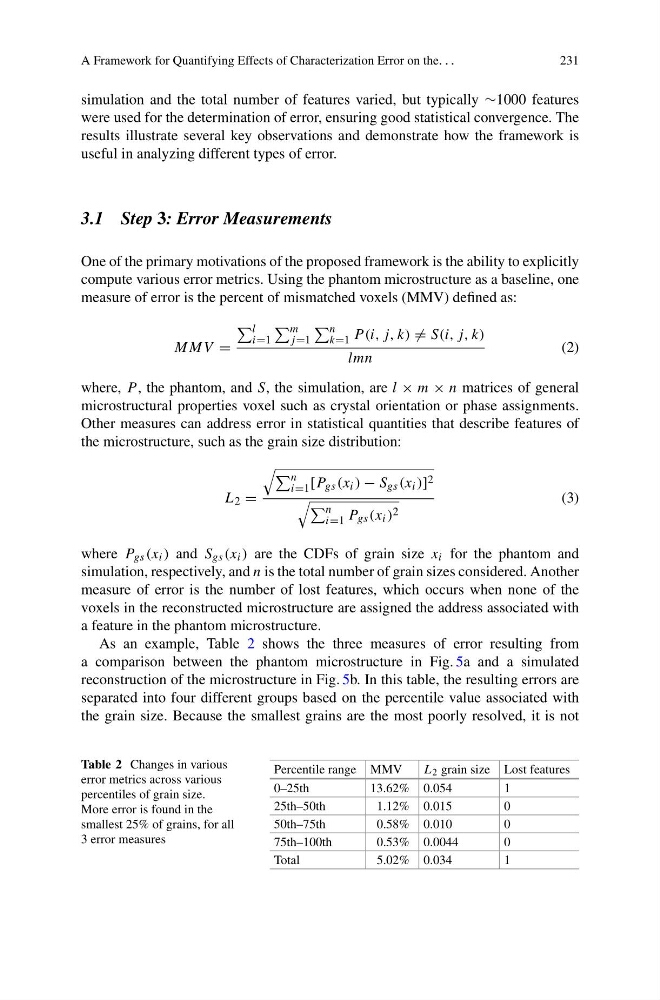
As an example, Table 2 shows the three measures of error resulting from
a comparison between the phantom microstructure in Fig. 5a and a simulated
reconstruction of the microstructure in Fig. 5b. In this table, the resulting errors are
separated into four different groups based on the percentile value associated with
the grain size. Because the smallest grains are the most poorly resolved, it is not
Table 2 Changes in various
error metrics across various
percentiles of grain size.
More error is found in the
smallest 25% of grains, for all
3 error measures
Percentile range MMV
L 2 grain size Lost features
0–25th
13.62% 0.054
1
25th–50th
1.12% 0.015
0
50th–75th
0.58% 0.010
0
75th–100th
0.53% 0.0044
0
Total
5.02% 0.034
1
231
simulation and the total number of features varied, but typically ∼1000 features
were used for the determination of error, ensuring good statistical convergence. The
results illustrate several key observations and demonstrate how the framework is
useful in analyzing different types of error.
3.1 Step 3: Error Measurements
One of the primary motivations of the proposed framework is the ability to explicitly
compute various error metrics. Using the phantom microstructure as a baseline, one
measure of error is the percent of mismatched voxels (MMV) defined as:
MMV =
l
i=1
m
j =1
n
k=1 P (i, j, k) = S(i, j, k)
lmn
(2)
where, P , the phantom, and S, the simulation, are l × m × n matrices of general
microstructural properties voxel such as crystal orientation or phase assignments.
Other measures can address error in statistical quantities that describe features of
the microstructure, such as the grain size distribution:
L 2 =
n
i=1 [P gs (x i ) − S gs (x i )] 2
n
i=1 P gs (x i ) 2
(3)
where P gs (x i ) and S gs (x i ) are the CDFs of grain size x i for the phantom and
simulation, respectively, and n is the total number of grain sizes considered. Another
measure of error is the number of lost features, which occurs when none of the
voxels in the reconstructed microstructure are assigned the address associated with
a feature in the phantom microstructure.
As an example, Table 2 shows the three measures of error resulting from
a comparison between the phantom microstructure in Fig. 5a and a simulated
reconstruction of the microstructure in Fig. 5b. In this table, the resulting errors are
separated into four different groups based on the percentile value associated with
the grain size. Because the smallest grains are the most poorly resolved, it is not
Table 2 Changes in various
error metrics across various
percentiles of grain size.
More error is found in the
smallest 25% of grains, for all
3 error measures
Percentile range MMV
L 2 grain size Lost features
0–25th
13.62% 0.054
1
25th–50th
1.12% 0.015
0
50th–75th
0.58% 0.010
0
75th–100th
0.53% 0.0044
0
Total
5.02% 0.034
1