

86
S. Ghosh et al.
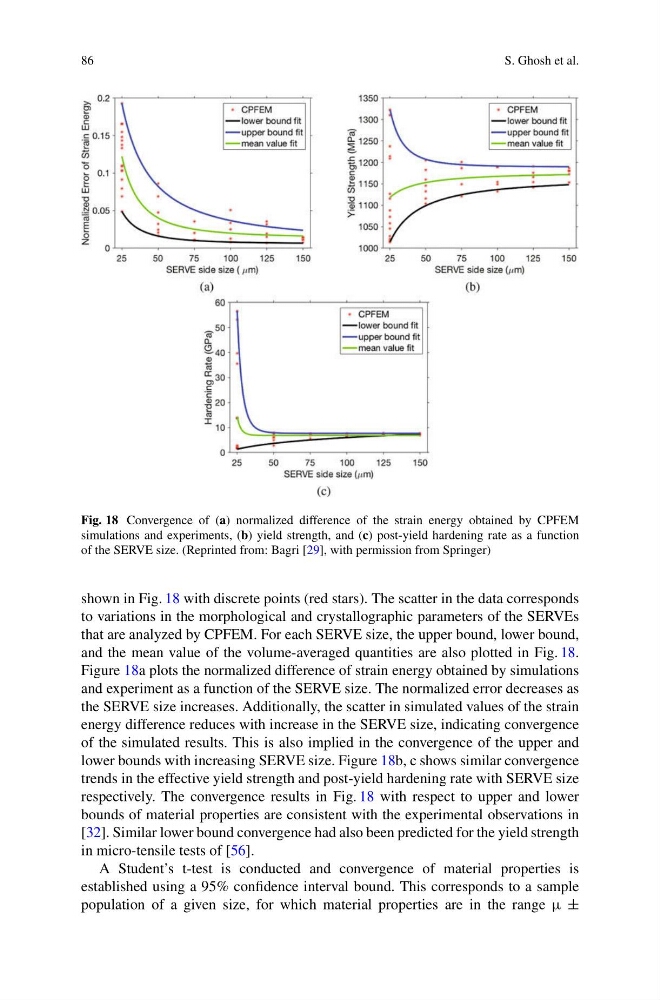
Fig. 18 Convergence of (a) normalized difference of the strain energy obtained by CPFEM
simulations and experiments, (b) yield strength, and (c) post-yield hardening rate as a function
of the SERVE size. (Reprinted from: Bagri [29], with permission from Springer)
shown in Fig. 18 with discrete points (red stars). The scatter in the data corresponds
to variations in the morphological and crystallographic parameters of the SERVEs
that are analyzed by CPFEM. For each SERVE size, the upper bound, lower bound,
and the mean value of the volume-averaged quantities are also plotted in Fig. 18.
Figure 18a plots the normalized difference of strain energy obtained by simulations
and experiment as a function of the SERVE size. The normalized error decreases as
the SERVE size increases. Additionally, the scatter in simulated values of the strain
energy difference reduces with increase in the SERVE size, indicating convergence
of the simulated results. This is also implied in the convergence of the upper and
lower bounds with increasing SERVE size. Figure 18b, c shows similar convergence
trends in the effective yield strength and post-yield hardening rate with SERVE size
respectively. The convergence results in Fig. 18 with respect to upper and lower
bounds of material properties are consistent with the experimental observations in
[32]. Similar lower bound convergence had also been predicted for the yield strength
in micro-tensile tests of [56].
A Student’s t-test is conducted and convergence of material properties is
established using a 95% confidence interval bound. This corresponds to a sample
population of a given size, for which material properties are in the range μ ±
S. Ghosh et al.
Fig. 18 Convergence of (a) normalized difference of the strain energy obtained by CPFEM
simulations and experiments, (b) yield strength, and (c) post-yield hardening rate as a function
of the SERVE size. (Reprinted from: Bagri [29], with permission from Springer)
shown in Fig. 18 with discrete points (red stars). The scatter in the data corresponds
to variations in the morphological and crystallographic parameters of the SERVEs
that are analyzed by CPFEM. For each SERVE size, the upper bound, lower bound,
and the mean value of the volume-averaged quantities are also plotted in Fig. 18.
Figure 18a plots the normalized difference of strain energy obtained by simulations
and experiment as a function of the SERVE size. The normalized error decreases as
the SERVE size increases. Additionally, the scatter in simulated values of the strain
energy difference reduces with increase in the SERVE size, indicating convergence
of the simulated results. This is also implied in the convergence of the upper and
lower bounds with increasing SERVE size. Figure 18b, c shows similar convergence
trends in the effective yield strength and post-yield hardening rate with SERVE size
respectively. The convergence results in Fig. 18 with respect to upper and lower
bounds of material properties are consistent with the experimental observations in
[32]. Similar lower bound convergence had also been predicted for the yield strength
in micro-tensile tests of [56].
A Student’s t-test is conducted and convergence of material properties is
established using a 95% confidence interval bound. This corresponds to a sample
population of a given size, for which material properties are in the range μ ±