

50
Chapter 5. Modelling asymmetric relationships
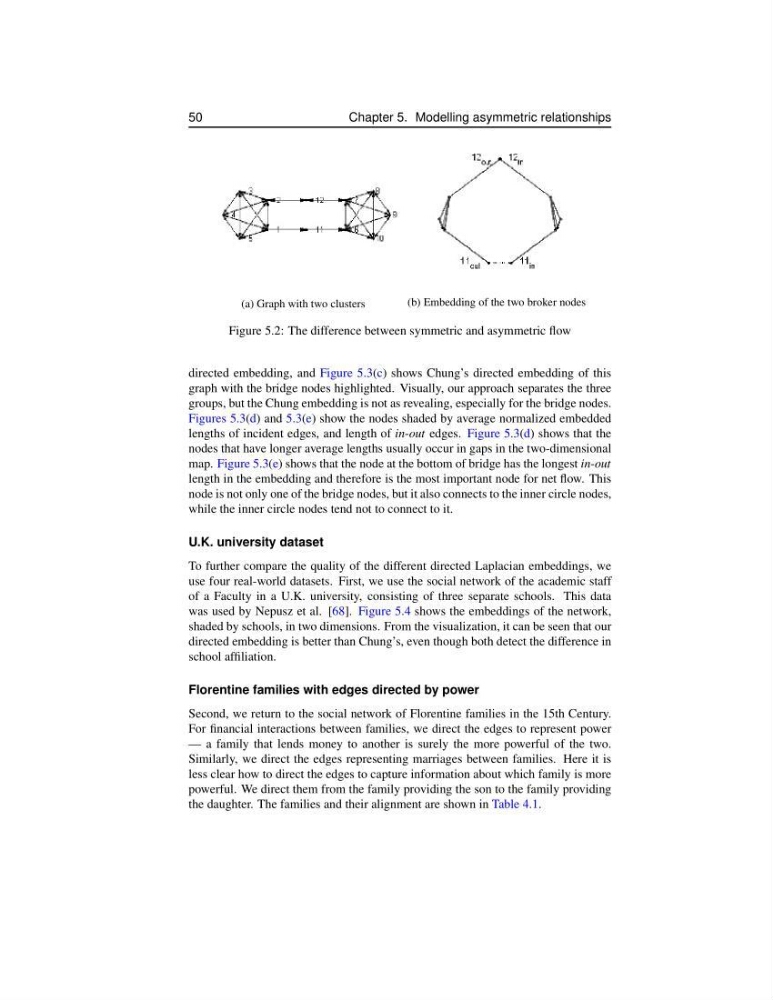
(a) Graph with two clusters
(b) Embedding of the two broker nodes
Figure 5.2: The difference between symmetric and asymmetric flow
directed embedding, and Figure 5.3(c) shows Chung’s directed embedding of this
graph with the bridge nodes highlighted. Visually, our approach separates the three
groups, but the Chung embedding is not as revealing, especially for the bridge nodes.
Figures 5.3(d) and 5.3(e) show the nodes shaded by average normalized embedded
lengths of incident edges, and length of in-out edges. Figure 5.3(d) shows that the
nodes that have longer average lengths usually occur in gaps in the two-dimensional
map. Figure 5.3(e) shows that the node at the bottom of bridge has the longest in-out
length in the embedding and therefore is the most important node for net flow. This
node is not only one of the bridge nodes, but it also connects to the inner circle nodes,
while the inner circle nodes tend not to connect to it.
U.K. university dataset
To further compare the quality of the different directed Laplacian embeddings, we
use four real-world datasets. First, we use the social network of the academic staff
of a Faculty in a U.K. university, consisting of three separate schools. This data
was used by Nepusz et al. [68]. Figure 5.4 shows the embeddings of the network,
shaded by schools, in two dimensions. From the visualization, it can be seen that our
directed embedding is better than Chung’s, even though both detect the difference in
school affiliation.
Florentine families with edges directed by power
Second, we return to the social network of Florentine families in the 15th Century.
For financial interactions between families, we direct the edges to represent power
— a family that lends money to another is surely the more powerful of the two.
Similarly, we direct the edges representing marriages between families. Here it is
less clear how to direct the edges to capture information about which family is more
powerful. We direct them from the family providing the son to the family providing
the daughter. The families and their alignment are shown in Table 4.1.
Chapter 5. Modelling asymmetric relationships
(a) Graph with two clusters
(b) Embedding of the two broker nodes
Figure 5.2: The difference between symmetric and asymmetric flow
directed embedding, and Figure 5.3(c) shows Chung’s directed embedding of this
graph with the bridge nodes highlighted. Visually, our approach separates the three
groups, but the Chung embedding is not as revealing, especially for the bridge nodes.
Figures 5.3(d) and 5.3(e) show the nodes shaded by average normalized embedded
lengths of incident edges, and length of in-out edges. Figure 5.3(d) shows that the
nodes that have longer average lengths usually occur in gaps in the two-dimensional
map. Figure 5.3(e) shows that the node at the bottom of bridge has the longest in-out
length in the embedding and therefore is the most important node for net flow. This
node is not only one of the bridge nodes, but it also connects to the inner circle nodes,
while the inner circle nodes tend not to connect to it.
U.K. university dataset
To further compare the quality of the different directed Laplacian embeddings, we
use four real-world datasets. First, we use the social network of the academic staff
of a Faculty in a U.K. university, consisting of three separate schools. This data
was used by Nepusz et al. [68]. Figure 5.4 shows the embeddings of the network,
shaded by schools, in two dimensions. From the visualization, it can be seen that our
directed embedding is better than Chung’s, even though both detect the difference in
school affiliation.
Florentine families with edges directed by power
Second, we return to the social network of Florentine families in the 15th Century.
For financial interactions between families, we direct the edges to represent power
— a family that lends money to another is surely the more powerful of the two.
Similarly, we direct the edges representing marriages between families. Here it is
less clear how to direct the edges to capture information about which family is more
powerful. We direct them from the family providing the son to the family providing
the daughter. The families and their alignment are shown in Table 4.1.