

118
Chapter 8. Modelling positive and negative relationships
(a) AER of Slashdot
(b) ANR of Slashdot
(c) MER of Slashdot
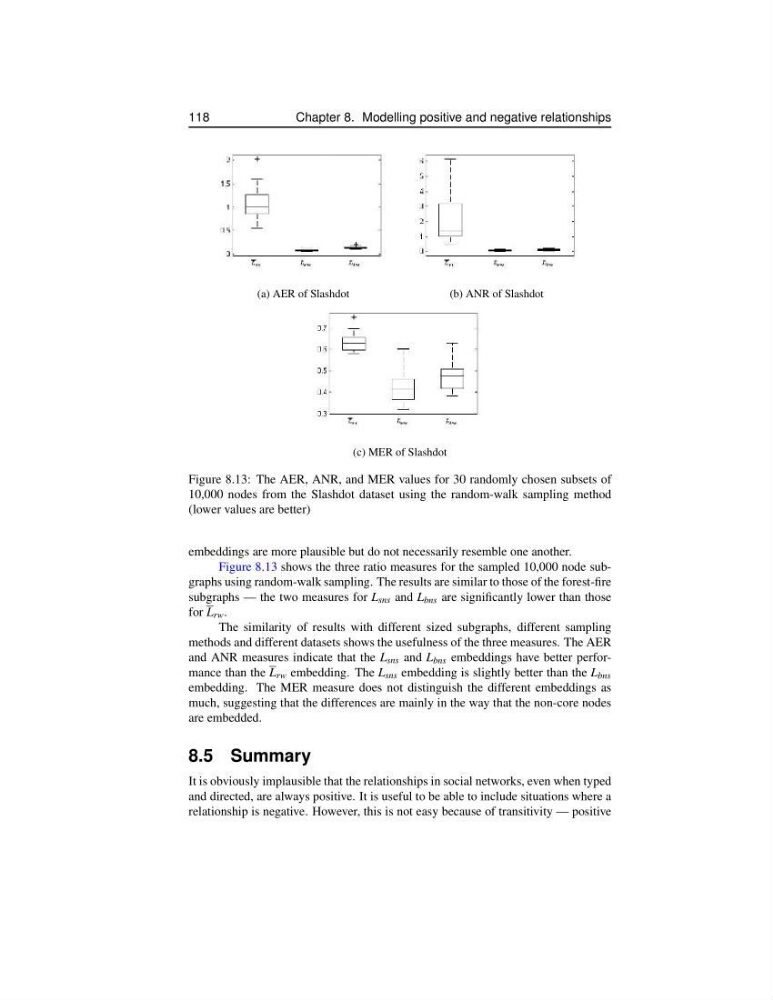
Figure 8.13: The AER, ANR, and MER values for 30 randomly chosen subsets of
10,000 nodes from the Slashdot dataset using the random-walk sampling method
(lower values are better)
embeddings are more plausible but do not necessarily resemble one another.
Figure 8.13 shows the three ratio measures for the sampled 10,000 node subgraphs using random-walk sampling. The results are similar to those of the forest-fire
subgraphs — the two measures for L sns and L bns are significantly lower than those
for L rw .
The similarity of results with different sized subgraphs, different sampling
methods and different datasets shows the usefulness of the three measures. The AER
and ANR measures indicate that the L sns and L bns embeddings have better performance than the L rw embedding. The L sns embedding is slightly better than the L bns
embedding. The MER measure does not distinguish the different embeddings as
much, suggesting that the differences are mainly in the way that the non-core nodes
are embedded.
8.5 Summary
It is obviously implausible that the relationships in social networks, even when typed
and directed, are always positive. It is useful to be able to include situations where a
relationship is negative. However, this is not easy because of transitivity — positive
Chapter 8. Modelling positive and negative relationships
(a) AER of Slashdot
(b) ANR of Slashdot
(c) MER of Slashdot
Figure 8.13: The AER, ANR, and MER values for 30 randomly chosen subsets of
10,000 nodes from the Slashdot dataset using the random-walk sampling method
(lower values are better)
embeddings are more plausible but do not necessarily resemble one another.
Figure 8.13 shows the three ratio measures for the sampled 10,000 node subgraphs using random-walk sampling. The results are similar to those of the forest-fire
subgraphs — the two measures for L sns and L bns are significantly lower than those
for L rw .
The similarity of results with different sized subgraphs, different sampling
methods and different datasets shows the usefulness of the three measures. The AER
and ANR measures indicate that the L sns and L bns embeddings have better performance than the L rw embedding. The L sns embedding is slightly better than the L bns
embedding. The MER measure does not distinguish the different embeddings as
much, suggesting that the differences are mainly in the way that the non-core nodes
are embedded.
8.5 Summary
It is obviously implausible that the relationships in social networks, even when typed
and directed, are always positive. It is useful to be able to include situations where a
relationship is negative. However, this is not easy because of transitivity — positive