

106
Chapter 8. Modelling positive and negative relationships
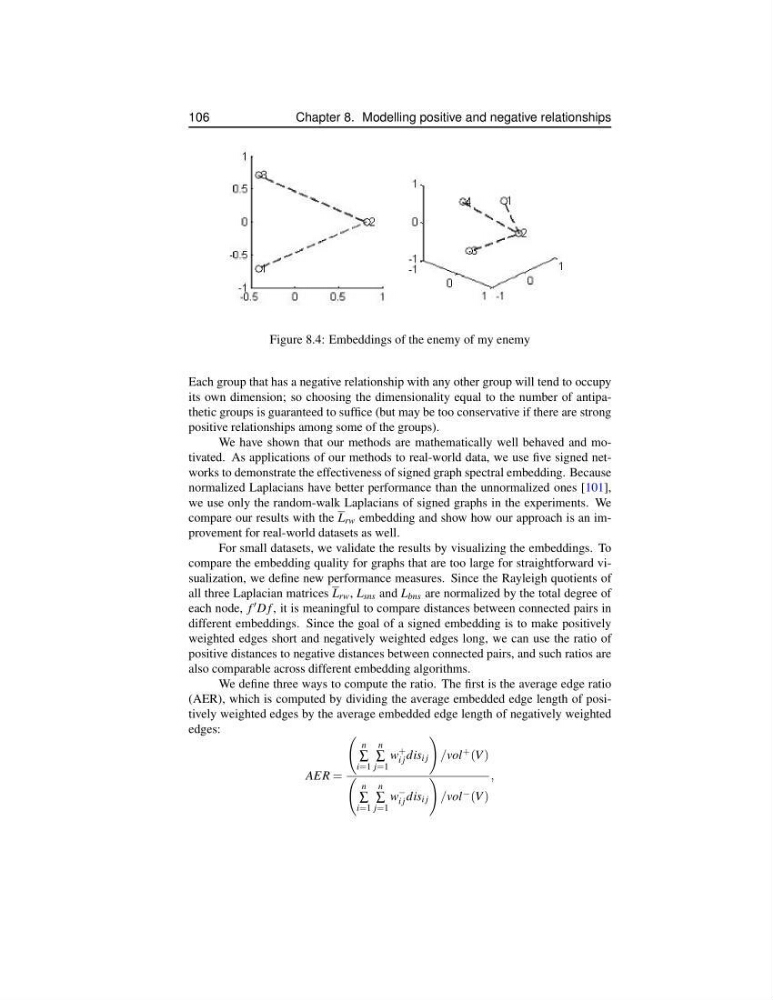
Figure 8.4: Embeddings of the enemy of my enemy
Each group that has a negative relationship with any other group will tend to occupy
its own dimension; so choosing the dimensionality equal to the number of antipathetic groups is guaranteed to suffice (but may be too conservative if there are strong
positive relationships among some of the groups).
We have shown that our methods are mathematically well behaved and motivated. As applications of our methods to real-world data, we use five signed networks to demonstrate the effectiveness of signed graph spectral embedding. Because
normalized Laplacians have better performance than the unnormalized ones [101],
we use only the random-walk Laplacians of signed graphs in the experiments. We
compare our results with the L rw embedding and show how our approach is an improvement for real-world datasets as well.
For small datasets, we validate the results by visualizing the embeddings. To
compare the embedding quality for graphs that are too large for straightforward visualization, we define new performance measures. Since the Rayleigh quotients of
all three Laplacian matrices L rw , L sns and L bns are normalized by the total degree of
each node, f D f , it is meaningful to compare distances between connected pairs in
different embeddings. Since the goal of a signed embedding is to make positively
weighted edges short and negatively weighted edges long, we can use the ratio of
positive distances to negative distances between connected pairs, and such ratios are
also comparable across different embedding algorithms.
We define three ways to compute the ratio. The first is the average edge ratio
(AER), which is computed by dividing the average embedded edge length of positively weighted edges by the average embedded edge length of negatively weighted
edges:
AER =
n
∑
i=1
n
∑
j=1
w
+
i j dis i j
/vol + (V )
n
∑
i=1
n
∑
j=1
w
−
i j dis i j
/vol − (V )
,
Chapter 8. Modelling positive and negative relationships
Figure 8.4: Embeddings of the enemy of my enemy
Each group that has a negative relationship with any other group will tend to occupy
its own dimension; so choosing the dimensionality equal to the number of antipathetic groups is guaranteed to suffice (but may be too conservative if there are strong
positive relationships among some of the groups).
We have shown that our methods are mathematically well behaved and motivated. As applications of our methods to real-world data, we use five signed networks to demonstrate the effectiveness of signed graph spectral embedding. Because
normalized Laplacians have better performance than the unnormalized ones [101],
we use only the random-walk Laplacians of signed graphs in the experiments. We
compare our results with the L rw embedding and show how our approach is an improvement for real-world datasets as well.
For small datasets, we validate the results by visualizing the embeddings. To
compare the embedding quality for graphs that are too large for straightforward visualization, we define new performance measures. Since the Rayleigh quotients of
all three Laplacian matrices L rw , L sns and L bns are normalized by the total degree of
each node, f D f , it is meaningful to compare distances between connected pairs in
different embeddings. Since the goal of a signed embedding is to make positively
weighted edges short and negatively weighted edges long, we can use the ratio of
positive distances to negative distances between connected pairs, and such ratios are
also comparable across different embedding algorithms.
We define three ways to compute the ratio. The first is the average edge ratio
(AER), which is computed by dividing the average embedded edge length of positively weighted edges by the average embedded edge length of negatively weighted
edges:
AER =
n
∑
i=1
n
∑
j=1
w
+
i j dis i j
/vol + (V )
n
∑
i=1
n
∑
j=1
w
−
i j dis i j
/vol − (V )
,