

50
Compact Models for Integrated Circuit Design
−
∂
∂
=
+
−
+
−
(
)
p
t
x
q
J x
x q
J x
G R x
p
p
p
p
∆
∆
∆
1
1
(
)
( )
(2.79)
The negative sign is due to the decrease of holes due to recombination; and
G p and R p are the generation and recombination rate of holes in the volume,
respectively. Then from Equation 2.79, we can show
−
∂
∂
=
∂
∂
+
−
(
)
p
t q
J
x
G R
p
p
p
1
(2.80)
Similarly, for electrons we can show
−
∂
∂
= −
∂
∂
+
−
(
)
n
t
q
J
x
G R
n
n
n
1
(2.81)
where:
R n and G n are the recombination and generation rate of electrons,
respectively
Equations 2.80 and 2.81 are called the continuity equations for holes and electrons, respectively, and describe the time-dependent relationship between
current density, recombination and generation rates, and space. They are
used for solving transient phenomena and diffusion with recombination–
generation of carriers.
Equations 2.60, 2.78, 2.80, and 2.81 constitute a complete set of 1D equations
to describe carrier, current, and field distributions in a semiconductor; however, they can easily be extended to 3D space. Given appropriate boundary
Δx
U
J p (x + Δx)
J p (x)
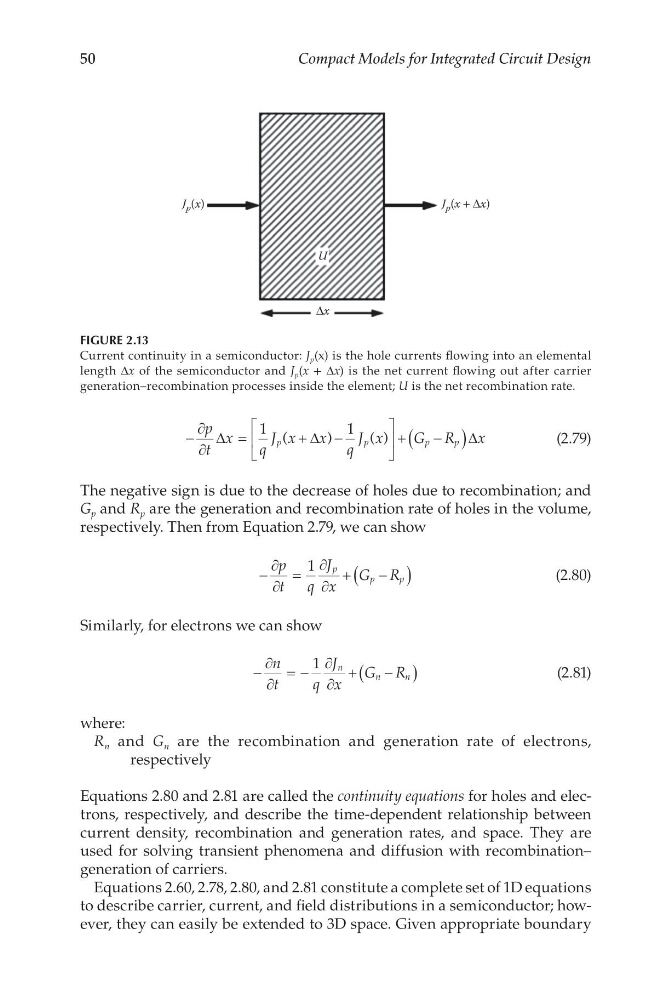
FIGURE 2.13
Current continuity in a semiconductor: J p (x) is the hole currents flowing into an elemental
length Δx of the semiconductor and J p (x + Δx) is the net current flowing out after carrier
generation–recombination processes inside the element; U is the net recombination rate.
Compact Models for Integrated Circuit Design
−
∂
∂
=
+
−
+
−
(
)
p
t
x
q
J x
x q
J x
G R x
p
p
p
p
∆
∆
∆
1
1
(
)
( )
(2.79)
The negative sign is due to the decrease of holes due to recombination; and
G p and R p are the generation and recombination rate of holes in the volume,
respectively. Then from Equation 2.79, we can show
−
∂
∂
=
∂
∂
+
−
(
)
p
t q
J
x
G R
p
p
p
1
(2.80)
Similarly, for electrons we can show
−
∂
∂
= −
∂
∂
+
−
(
)
n
t
q
J
x
G R
n
n
n
1
(2.81)
where:
R n and G n are the recombination and generation rate of electrons,
respectively
Equations 2.80 and 2.81 are called the continuity equations for holes and electrons, respectively, and describe the time-dependent relationship between
current density, recombination and generation rates, and space. They are
used for solving transient phenomena and diffusion with recombination–
generation of carriers.
Equations 2.60, 2.78, 2.80, and 2.81 constitute a complete set of 1D equations
to describe carrier, current, and field distributions in a semiconductor; however, they can easily be extended to 3D space. Given appropriate boundary
Δx
U
J p (x + Δx)
J p (x)
FIGURE 2.13
Current continuity in a semiconductor: J p (x) is the hole currents flowing into an elemental
length Δx of the semiconductor and J p (x + Δx) is the net current flowing out after carrier
generation–recombination processes inside the element; U is the net recombination rate.