

222
Compact Models for Integrated Circuit Design
Discuss the impact of the model parameters K1 and K2 on V th of an
MOS transistor.
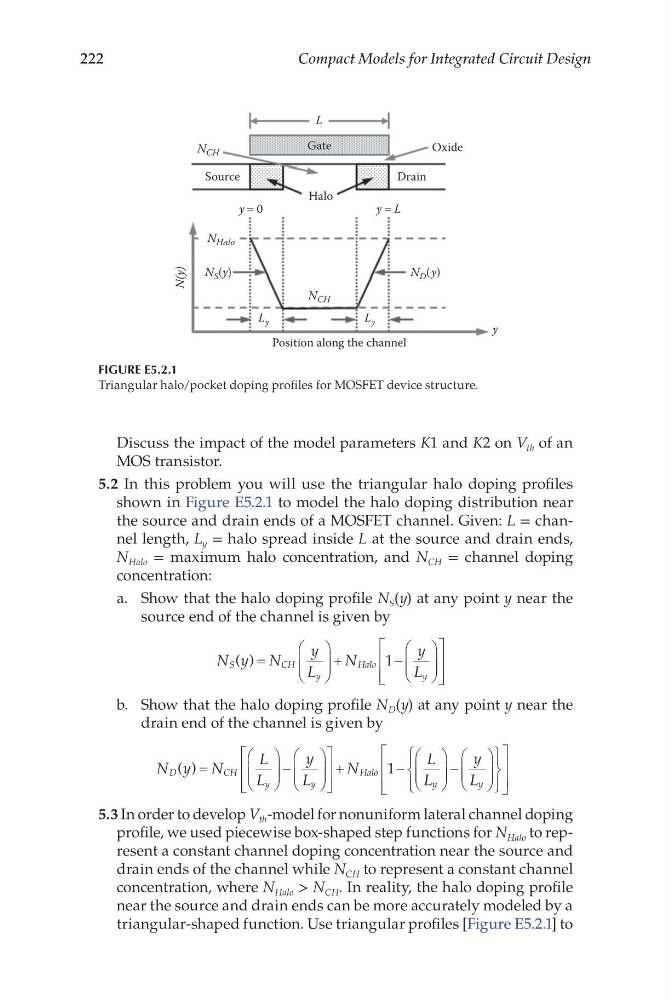
5.2 In this problem you will use the triangular halo doping profiles
shown in Figure E5.2.1 to model the halo doping distribution near
the source and drain ends of a MOSFET channel. Given: L = channel length, L y = halo spread inside L at the source and drain ends,
N Halo = maximum halo concentration, and N CH = channel doping
concentration:
a. Show that the halo doping profile N S (y) at any point y near the
source end of the channel is given by
N y N
y
L
N
y
L
S
C H
y
Halo
y
( ) =
+
−
1
b. Show that the halo doping profile N D (y) at any point y near the
drain end of the channel is given by
N y N
L
L
y
L
N
L
L
D
C H
y
y
Halo
y
( ) =
−
+
−
1
−
y
L y
5.3 In order to develop V th -model for nonuniform lateral channel doping
profile, we used piecewise box-shaped step functions for N Halo to represent a constant channel doping concentration near the source and
drain ends of the channel while N CH to represent a constant channel
concentration, where N Halo > N CH . In reality, the halo doping profile
near the source and drain ends can be more accurately modeled by a
triangular-shaped function. Use triangular profiles [Figure E5.2.1] to
Position along the channel
N CH
N(y)
y
N S (y)
N Halo
Halo
Gate
Drain
Oxide
Source
N CH
L
N D (y)
y = L
y = 0
L y
L y
FIGURE E5.2.1
Triangular halo/pocket doping profiles for MOSFET device structure.
Compact Models for Integrated Circuit Design
Discuss the impact of the model parameters K1 and K2 on V th of an
MOS transistor.
5.2 In this problem you will use the triangular halo doping profiles
shown in Figure E5.2.1 to model the halo doping distribution near
the source and drain ends of a MOSFET channel. Given: L = channel length, L y = halo spread inside L at the source and drain ends,
N Halo = maximum halo concentration, and N CH = channel doping
concentration:
a. Show that the halo doping profile N S (y) at any point y near the
source end of the channel is given by
N y N
y
L
N
y
L
S
C H
y
Halo
y
( ) =
+
−
1
b. Show that the halo doping profile N D (y) at any point y near the
drain end of the channel is given by
N y N
L
L
y
L
N
L
L
D
C H
y
y
Halo
y
( ) =
−
+
−
1
−
y
L y
5.3 In order to develop V th -model for nonuniform lateral channel doping
profile, we used piecewise box-shaped step functions for N Halo to represent a constant channel doping concentration near the source and
drain ends of the channel while N CH to represent a constant channel
concentration, where N Halo > N CH . In reality, the halo doping profile
near the source and drain ends can be more accurately modeled by a
triangular-shaped function. Use triangular profiles [Figure E5.2.1] to
Position along the channel
N CH
N(y)
y
N S (y)
N Halo
Halo
Gate
Drain
Oxide
Source
N CH
L
N D (y)
y = L
y = 0
L y
L y
FIGURE E5.2.1
Triangular halo/pocket doping profiles for MOSFET device structure.