

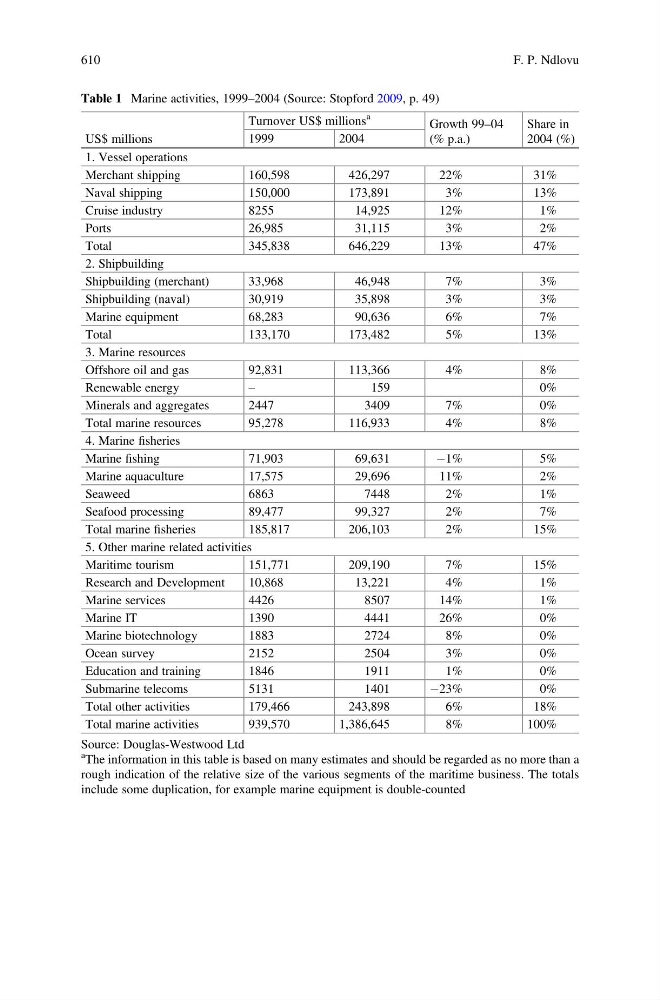
Table 1 Marine activities, 1999–2004 (Source: Stopford 2009, p. 49)
US$ millions
Turnover US$ millions
a
Growth 99–04
(% p.a.)
Share in
2004 (%)
1999
2004
1. Vessel operations
Merchant shipping
160,598
426,297
22%
31%
Naval shipping
150,000
173,891
3%
13%
Cruise industry
8255
14,925
12%
1%
Ports
26,985
31,115
3%
2%
Total
345,838
646,229
13%
47%
2. Shipbuilding
Shipbuilding (merchant)
33,968
46,948
7%
3%
Shipbuilding (naval)
30,919
35,898
3%
3%
Marine equipment
68,283
90,636
6%
7%
Total
133,170
173,482
5%
13%
3. Marine resources
Offshore oil and gas
92,831
113,366
4%
8%
Renewable energy
–
159
0%
Minerals and aggregates
2447
3409
7%
0%
Total marine resources
95,278
116,933
4%
8%
4. Marine fisheries
Marine fishing
71,903
69,631
À1%
5%
Marine aquaculture
17,575
29,696
11%
2%
Seaweed
6863
7448
2%
1%
Seafood processing
89,477
99,327
2%
7%
Total marine fisheries
185,817
206,103
2%
15%
5. Other marine related activities
Maritime tourism
151,771
209,190
7%
15%
Research and Development
10,868
13,221
4%
1%
Marine services
4426
8507
14%
1%
Marine IT
1390
4441
26%
0%
Marine biotechnology
1883
2724
8%
0%
Ocean survey
2152
2504
3%
0%
Education and training
1846
1911
1%
0%
Submarine telecoms
5131
1401
À23%
0%
Total other activities
179,466
243,898
6%
18%
Total marine activities
939,570
1,386,645
8%
100%
Source: Douglas-Westwood Ltd
a The information in this table is based on many estimates and should be regarded as no more than a
rough indication of the relative size of the various segments of the maritime business. The totals
include some duplication, for example marine equipment is double-counted
610
F. P. Ndlovu