

72
R. Pagan
for people with moderate and severe disabilities. We also find that a higher participation in leisure activities contributes to reducing the levels of loneliness reported by
all individuals (with disabilities or not). For example, having meetings with family
and friends ‘weekly’ as compared to ‘never’ reduces the loneliness scores around 0.4
points for people without disabilities, whereas for people with moderate and severe
disabilities this reduction is 0.52 and 0.90 points, respectively. These differentials
in terms of loneliness between the extreme categories ‘never’ and ‘weekly’ are not
always the same for other leisure activities. For example, this range is quite reduced
for the leisure activities ‘artistic activities’ and ‘attending church’ for people without
disabilities.
The higher loneliness scores found for people with moderate and severe disabilities, in comparison to people without disabilities, may be explained by the lower
levels of participation that people with disabilities (in particular those with severe
disabilities) have in some leisure activities. According to Wade and Hoover (1985)
and Smith (1987), we can still find many internal and external barriers (e.g. physical, attitudinal, environmental, institutional, social attitudes, lack of physical fitness,
and lack of motors and cognitive skills) that limit full participation and access of
people with disabilities to leisure environments. To shed further light on this question,
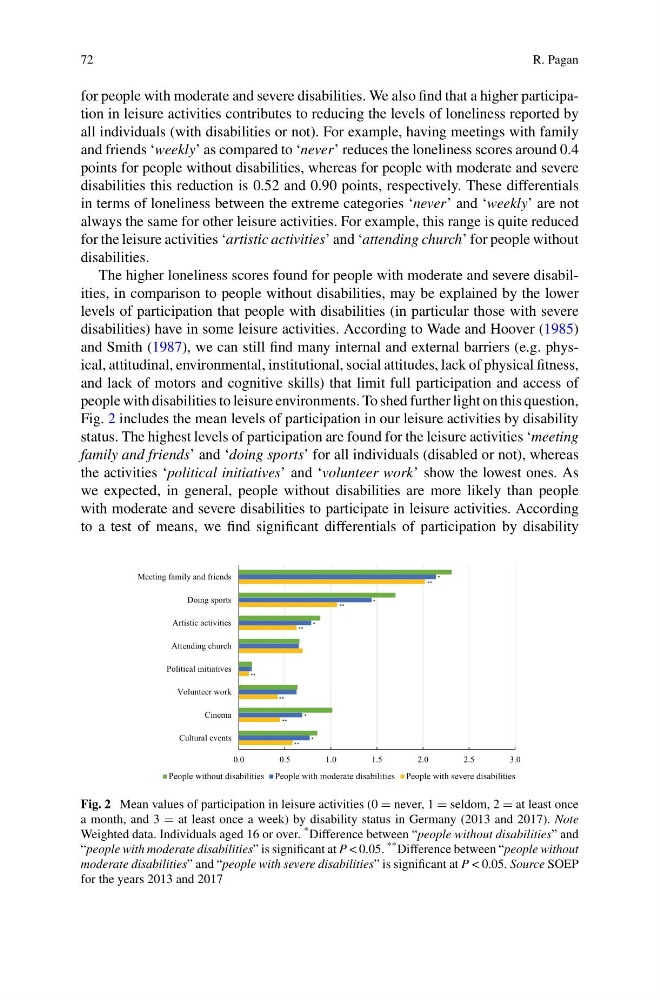
Fig. 2 includes the mean levels of participation in our leisure activities by disability
status. The highest levels of participation are found for the leisure activities ‘meeting
family and friends’ and ‘doing sports’ for all individuals (disabled or not), whereas
the activities ‘political initiatives’ and ‘volunteer work’ show the lowest ones. As
we expected, in general, people without disabilities are more likely than people
with moderate and severe disabilities to participate in leisure activities. According
to a test of means, we find significant differentials of participation by disability
0.0
0.5
1.0
1.5
2.0
2.5
3.0
Cultural events
Cinema
Volunteer work
Political initiatives
Attending church
Artistic activities
Doing sports
Meeting family and friends
People without disabilities People with moderate disabilities People with severe disabilities
*
**
*
**
**
**
*
**
**
**
*
*
Fig. 2 Mean values of participation in leisure activities (0 = never, 1 = seldom, 2 = at least once
a month, and 3 = at least once a week) by disability status in Germany (2013 and 2017). Note
Weighted data. Individuals aged 16 or over. * Difference between “people without disabilities” and
“people with moderate disabilities” is significant at P < 0.05. ** Difference between “people without
moderate disabilities” and “people with severe disabilities” is significant at P < 0.05. Source SOEP
for the years 2013 and 2017
R. Pagan
for people with moderate and severe disabilities. We also find that a higher participation in leisure activities contributes to reducing the levels of loneliness reported by
all individuals (with disabilities or not). For example, having meetings with family
and friends ‘weekly’ as compared to ‘never’ reduces the loneliness scores around 0.4
points for people without disabilities, whereas for people with moderate and severe
disabilities this reduction is 0.52 and 0.90 points, respectively. These differentials
in terms of loneliness between the extreme categories ‘never’ and ‘weekly’ are not
always the same for other leisure activities. For example, this range is quite reduced
for the leisure activities ‘artistic activities’ and ‘attending church’ for people without
disabilities.
The higher loneliness scores found for people with moderate and severe disabilities, in comparison to people without disabilities, may be explained by the lower
levels of participation that people with disabilities (in particular those with severe
disabilities) have in some leisure activities. According to Wade and Hoover (1985)
and Smith (1987), we can still find many internal and external barriers (e.g. physical, attitudinal, environmental, institutional, social attitudes, lack of physical fitness,
and lack of motors and cognitive skills) that limit full participation and access of
people with disabilities to leisure environments. To shed further light on this question,
Fig. 2 includes the mean levels of participation in our leisure activities by disability
status. The highest levels of participation are found for the leisure activities ‘meeting
family and friends’ and ‘doing sports’ for all individuals (disabled or not), whereas
the activities ‘political initiatives’ and ‘volunteer work’ show the lowest ones. As
we expected, in general, people without disabilities are more likely than people
with moderate and severe disabilities to participate in leisure activities. According
to a test of means, we find significant differentials of participation by disability
0.0
0.5
1.0
1.5
2.0
2.5
3.0
Cultural events
Cinema
Volunteer work
Political initiatives
Attending church
Artistic activities
Doing sports
Meeting family and friends
People without disabilities People with moderate disabilities People with severe disabilities
*
**
*
**
**
**
*
**
**
**
*
*
Fig. 2 Mean values of participation in leisure activities (0 = never, 1 = seldom, 2 = at least once
a month, and 3 = at least once a week) by disability status in Germany (2013 and 2017). Note
Weighted data. Individuals aged 16 or over. * Difference between “people without disabilities” and
“people with moderate disabilities” is significant at P < 0.05. ** Difference between “people without
moderate disabilities” and “people with severe disabilities” is significant at P < 0.05. Source SOEP
for the years 2013 and 2017